

Question: Part Three (20 Marks) TABLE 1 (below) includes end of year price data on the NASDAQ, Tesla (TSLA) and JP Morgan (JPM) from years
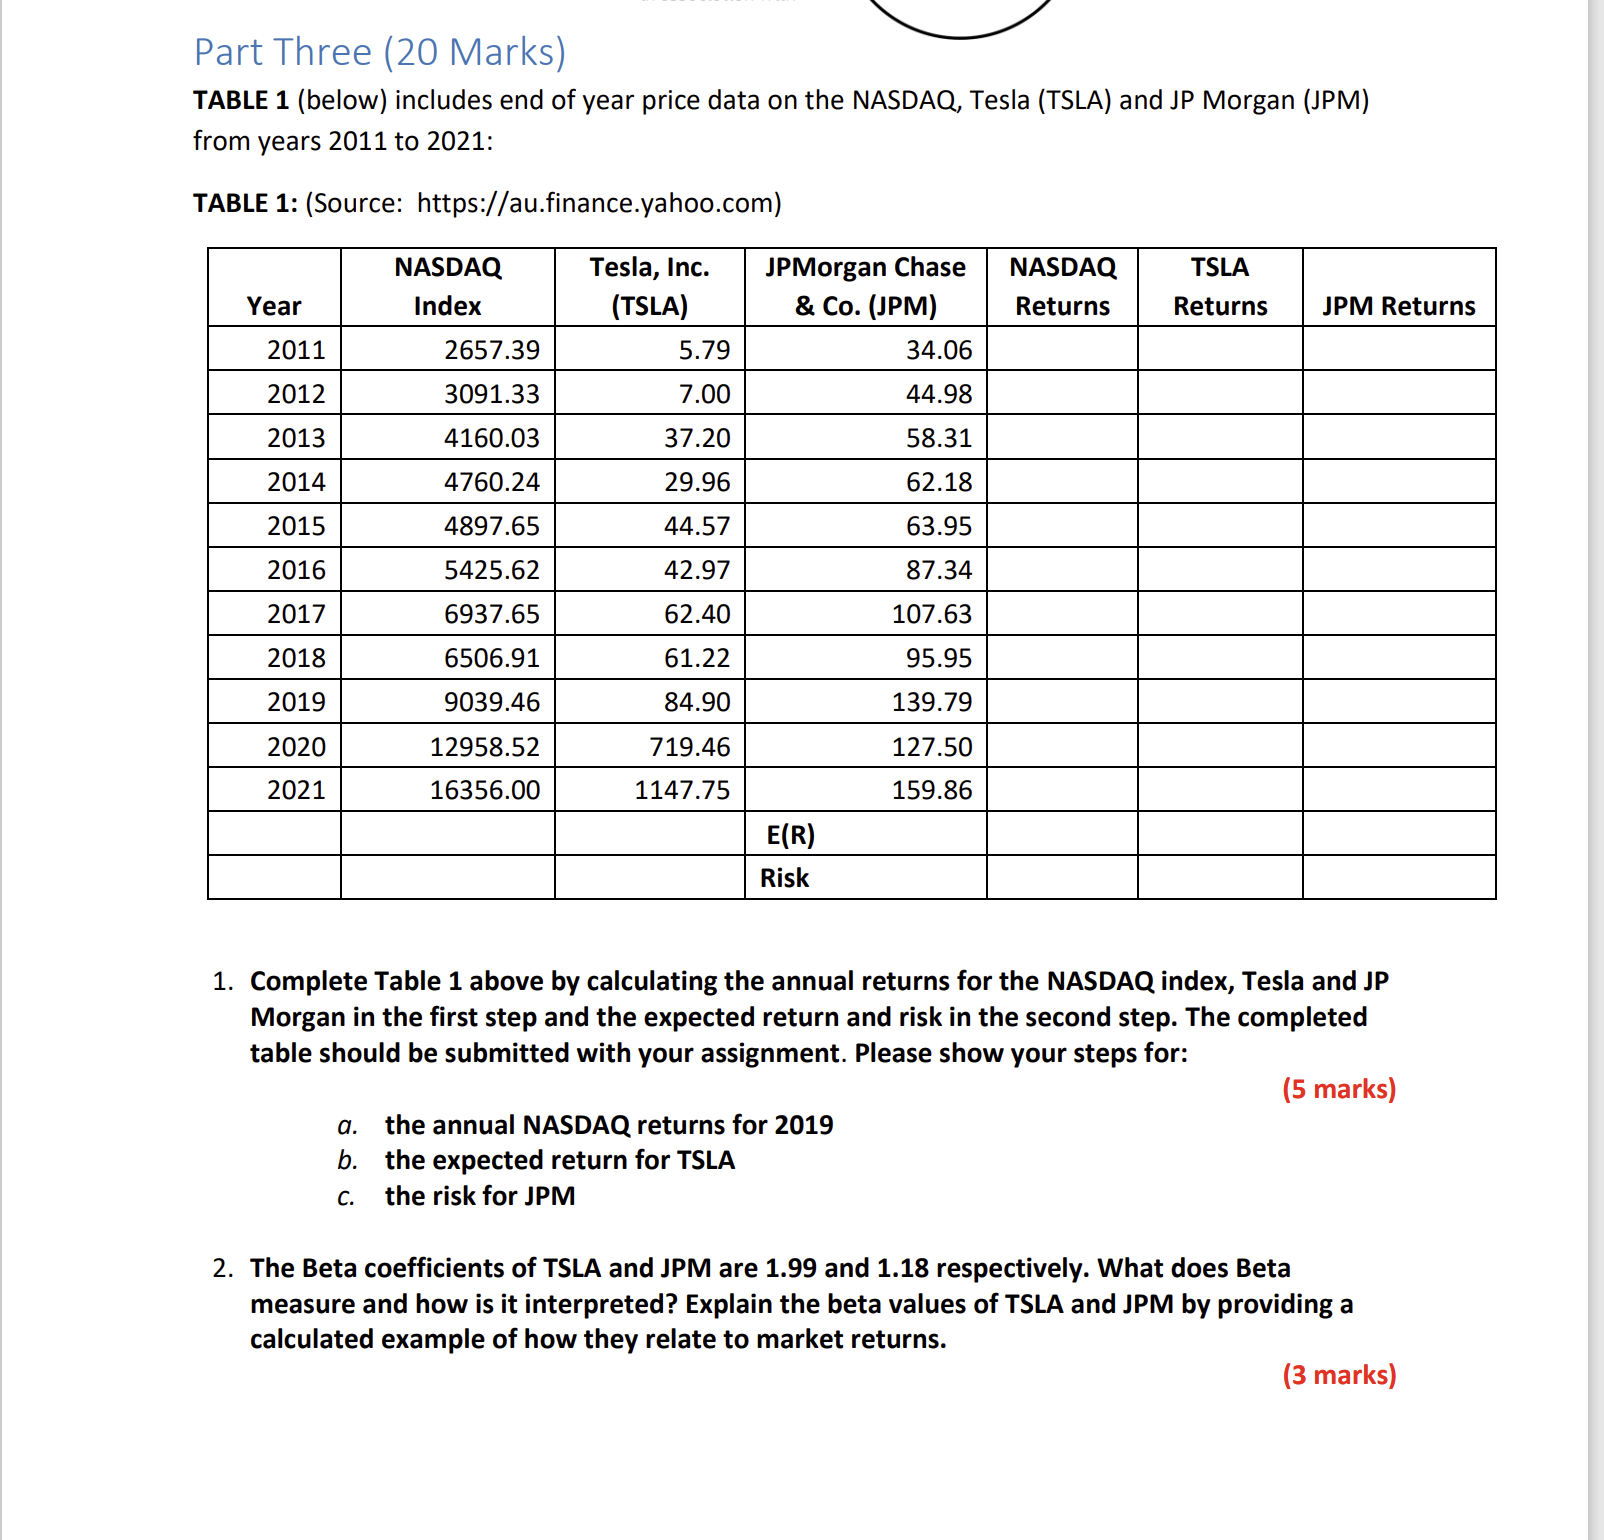
Part Three (20 Marks) TABLE 1 (below) includes end of year price data on the NASDAQ, Tesla (TSLA) and JP Morgan (JPM) from years 2011 to 2021: TABLE 1: (Source: https://au.finance.yahoo.com) NASDAQ Year Index Tesla, Inc. (TSLA) JPMorgan Chase & Co. (JPM) NASDAQ TSLA Returns Returns JPM Returns 2011 2657.39 5.79 34.06 2012 3091.33 7.00 44.98 2013 4160.03 37.20 58.31 2014 4760.24 29.96 62.18 2015 4897.65 44.57 63.95 2016 5425.62 42.97 87.34 2017 6937.65 62.40 107.63 2018 6506.91 61.22 95.95 2019 9039.46 84.90 139.79 2020 12958.52 719.46 127.50 2021 16356.00 1147.75 159.86 E(R) Risk 1. Complete Table 1 above by calculating the annual returns for the NASDAQ index, Tesla and JP Morgan in the first step and the expected return and risk in the second step. The completed table should be submitted with your assignment. Please show your steps for: a. the annual NASDAQ returns for 2019 b. the expected return for TSLA C. the risk for JPM (5 marks) 2. The Beta coefficients of TSLA and JPM are 1.99 and 1.18 respectively. What does Beta measure and how is it interpreted? Explain the beta values of TSLA and JPM by providing a calculated example of how they relate to market returns. (3 marks)
Step by Step Solution
3.39 Rating (143 Votes )
There are 3 Steps involved in it
Lets complete Table 1 and then add... View full answer

Get step-by-step solutions from verified subject matter experts