

Question: Part1: 1. Given the raw data in Table I. Make a frequencyr table and using the fre quency tahle, solve for the mean of the
Part1:
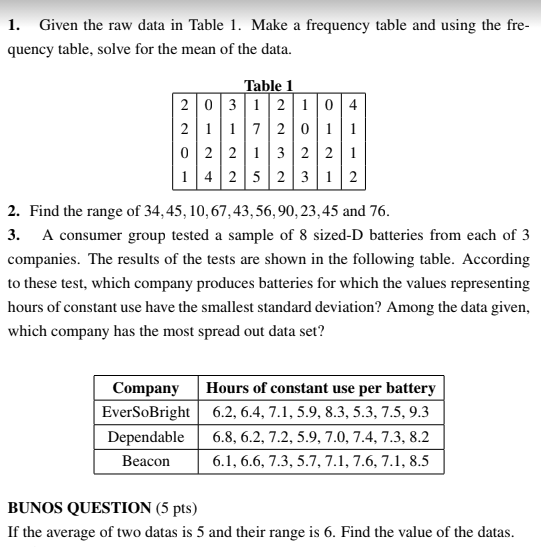
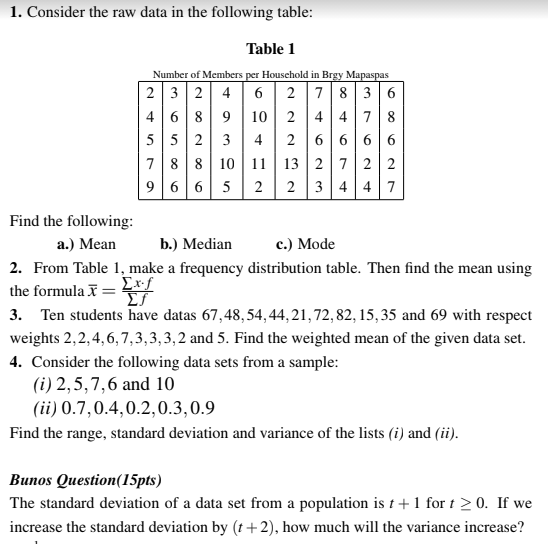
1. Given the raw data in Table I. Make a frequencyr table and using the fre quency tahle, solve for the mean of the data. Table l 2.. Find the range of 34,45, 16,6143, 56,99,23,45 and T6. 3. A consumer group tested a sample of 8 sizedD batteries from each of 3 companies. The results of the tests are shown in the following table. According to these test, which companyI produces batteries for which the values representing hours of constant use have the smallest standard deviation? Among the data given, which company has the most spread out data set? Hours ofcolltant use per battery EverSoBright 6.2, 6.4, 3.1, 5.9, 8.3, 5.3, '15, 9.3 6.8, 6.2, 12, 5.9, 7.8, 14, '13, 8.2 6.1, 6.6, 13,53", 11,16, '1], 8.5 BUNDLE QUESTIIDN (5 pts) If the average of two datas is 5 and their range is 6. Find the value of the datas. I. Consider the raw data in the following table: Table 1 Ntmthctofh'lctrbcrs- Household - 2 2 4 2 11'] ll 13 5 2 Find the following: a.) Mean It.) Median c.) Mode 2.. From Tahle L make a frequency distribution tahle. Then nd the mean using the formula E = % 3. Ten students have datas orgasm-14,2132, 32, 1555 and ti? with respect weights 233,613,335; and 5. Find the weighted mean of the given data set. 4. Consider the following data sets from a sample: to 2,5,?,6 and ll] (it?) .?,.4,.2,.3,.9 Find the ranger, standard deviation and variance of the lists fij and {if}. Barnes Questionfpts) The standard deviation of a data set from a population is t + l for r :3 {L If we increase the standard deviation by {r + 2}, how much will the variance increase
Step by Step Solution
There are 3 Steps involved in it

Get step-by-step solutions from verified subject matter experts