

Question: Participation Discussion 1. Values, Parameters and Samples Part 1. We are all grains of sand in the ocean of Statistics. Compare your individual value with
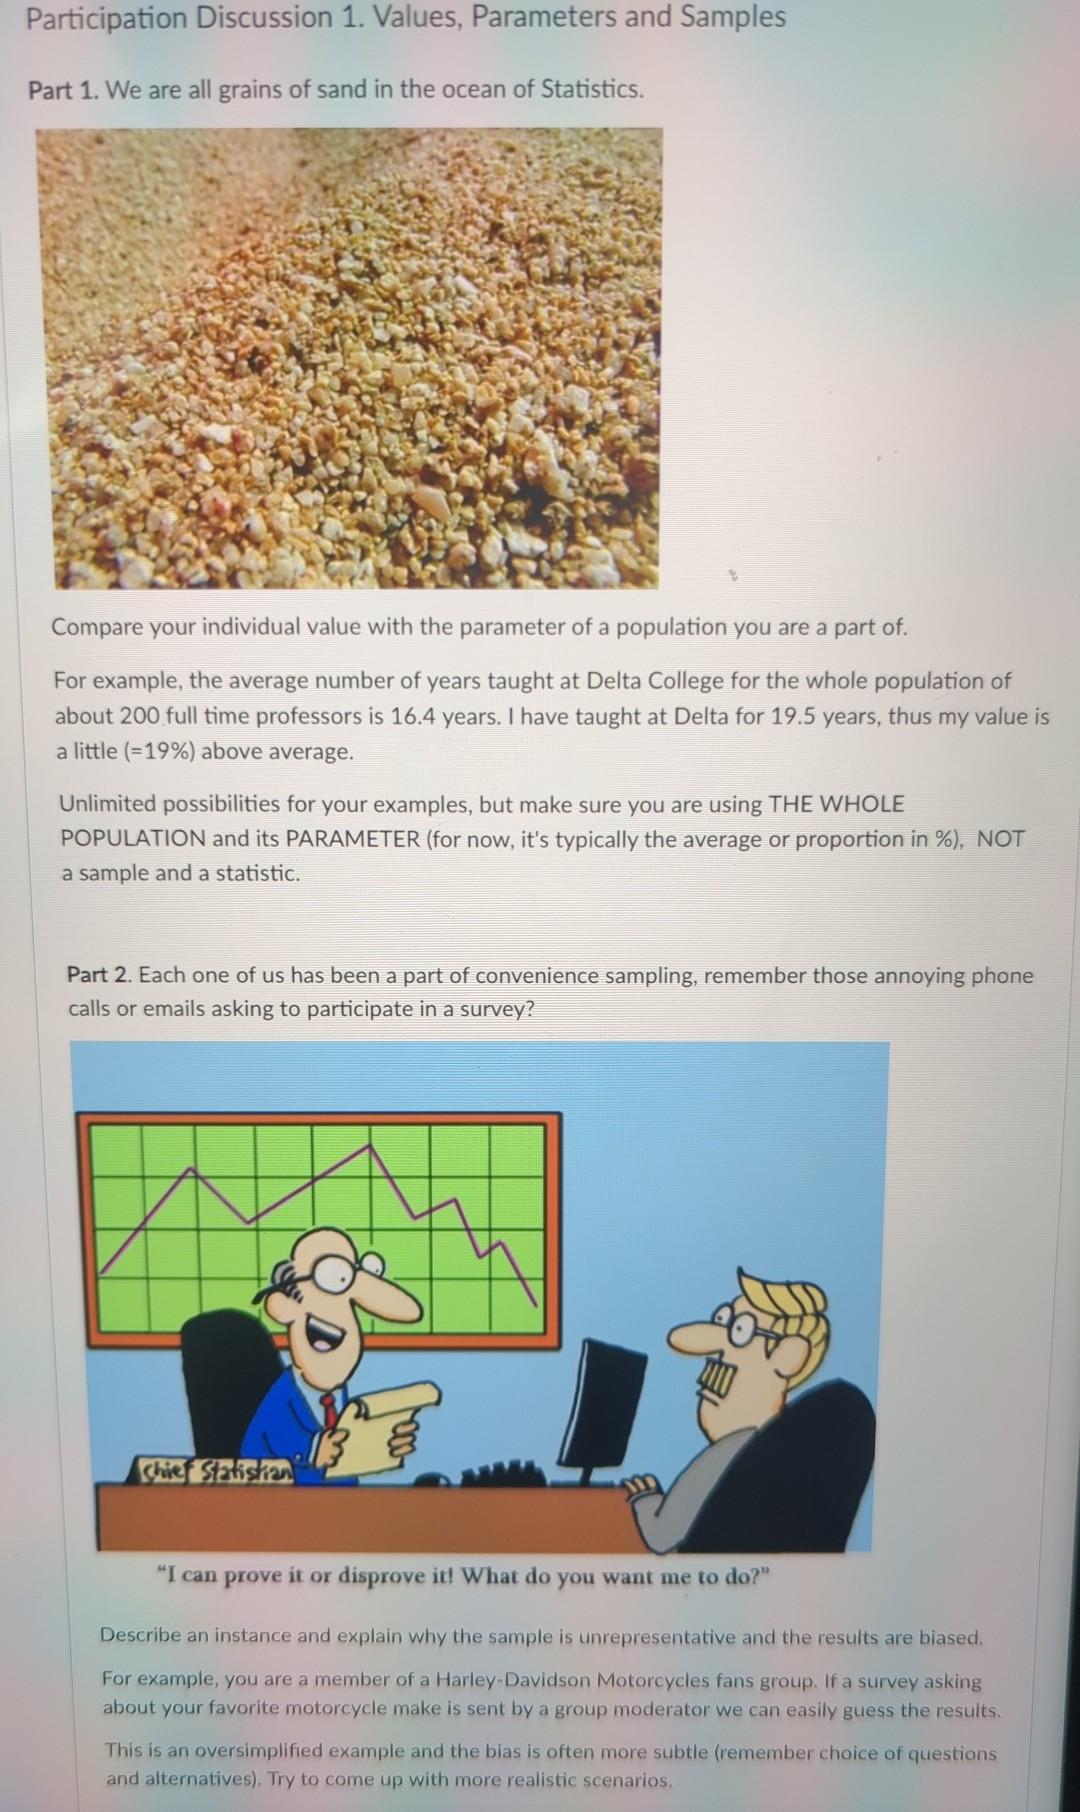
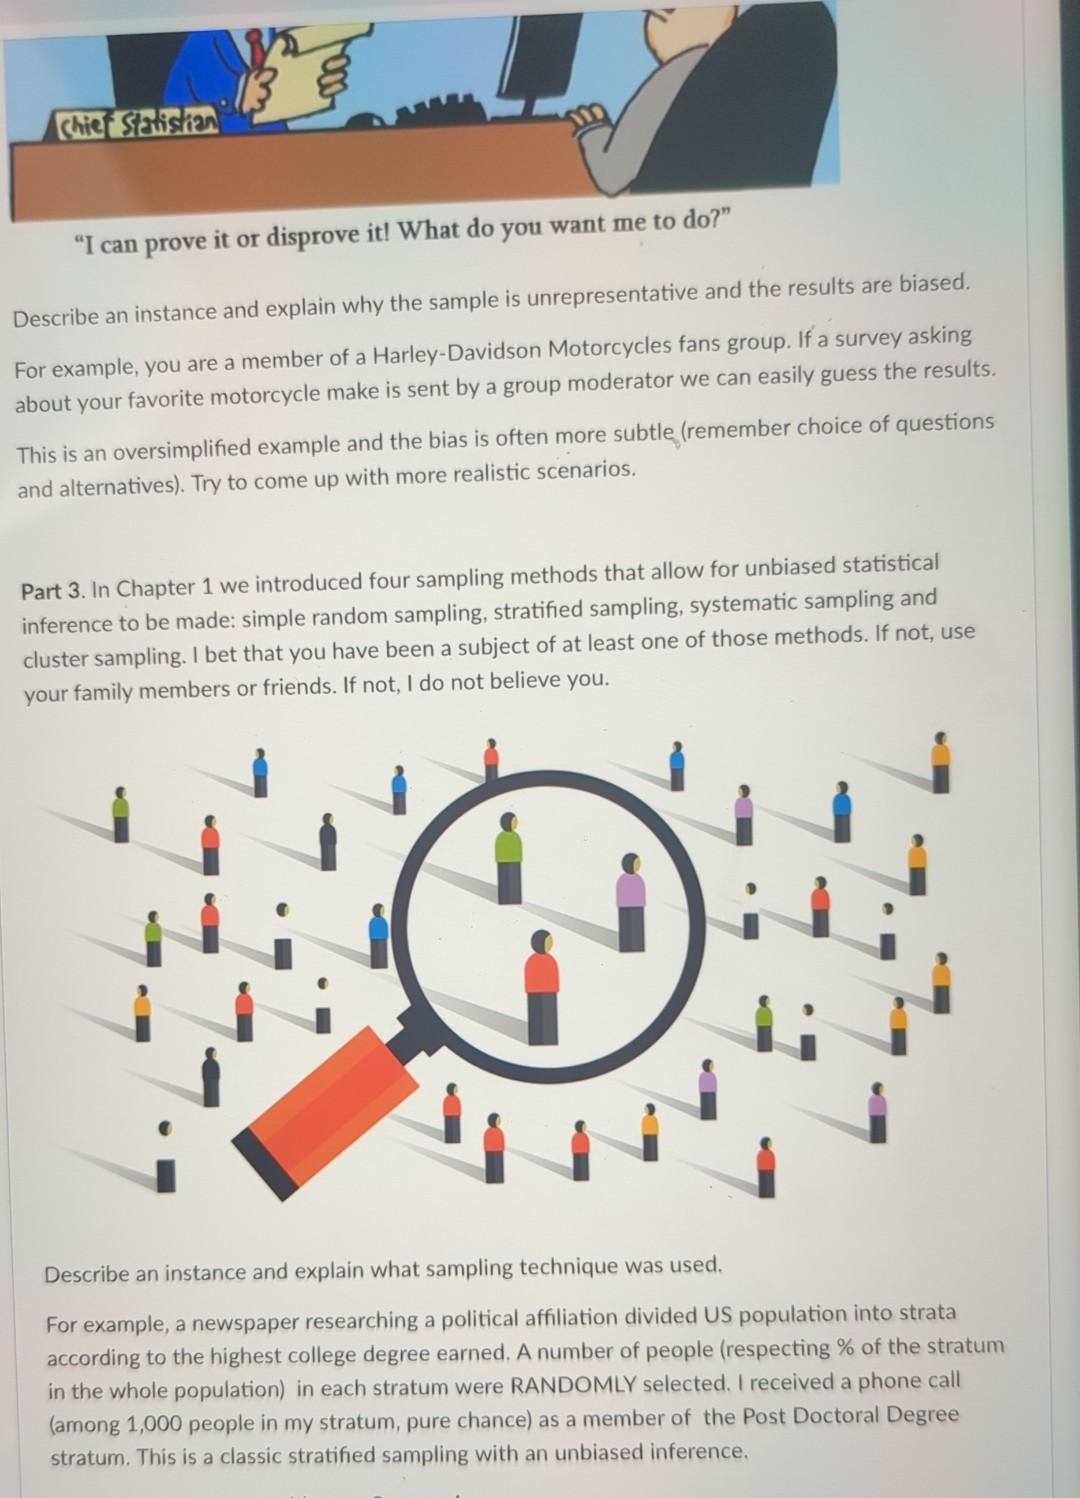
Participation Discussion 1. Values, Parameters and Samples Part 1. We are all grains of sand in the ocean of Statistics. Compare your individual value with the parameter of a population you are a part of. For example, the average number of years taught at Delta College for the whole population of about 200 full time professors is 16.4 years. I have taught at Delta for 19.5 years, thus my value is a little (=19%) above average. Unlimited possibilities for your examples, but make sure you are using THE WHOLE POPULATION and its PARAMETER (for now, it's typically the average or proportion in \%), NOT a sample and a statistic. Part 2. Each one of us has been a part of convenience sampling, remember those annoying phone calls or emails asking to participate in a survey? "I can prove it or disprove it! What do you want me to do?" Describe an instance and explain why the sample is unrepresentative and the results are biased. For example, you are a member of a Harley-Davidson Motorcycles fans group. If a survey asking about your favorite motorcycle make is sent by a group moderator we can easily guess the results. This is an oversimplified example and the bias is often more subtle (remember choice of questions and alternatives). Try to come up with more realistic scenarios. "I can prove it or disprove it! What do you want me to do?" Describe an instance and explain why the sample is unrepresentative and the results are biased. For example, you are a member of a Harley-Davidson Motorcycles fans group. If a survey asking about your favorite motorcycle make is sent by a group moderator we can easily guess the results. This is an oversimplified example and the bias is often more subtle (remember choice of questions and alternatives). Try to come up with more realistic scenarios. Part 3. In Chapter 1 we introduced four sampling methods that allow for unbiased statistical inference to be made: simple random sampling, stratified sampling, systematic sampling and cluster sampling. I bet that you have been a subject of at least one of those methods. If not, use your family members or friends. If not, I do not believe you. Describe an instance and explain what sampling technique was used. For example, a newspaper researching a political affiliation divided US population into strata according to the highest college degree earned. A number of people (respecting % of the stratum in the whole population) in each stratum were RANDOMLY selected. I received a phone call (among 1,000 people in my stratum, pure chance) as a member of the Post Doctoral Degree stratum. This is a classic stratified sampling with an unbiased inference
Step by Step Solution
There are 3 Steps involved in it

Get step-by-step solutions from verified subject matter experts