

Question: Paste E2 fx fx =AVERAGE(D$2,D$14) 1 Month A Demand B C D E Yearly average Seasonal Index Average SI 2 1/1/20 2422 2944.4167 0.8226
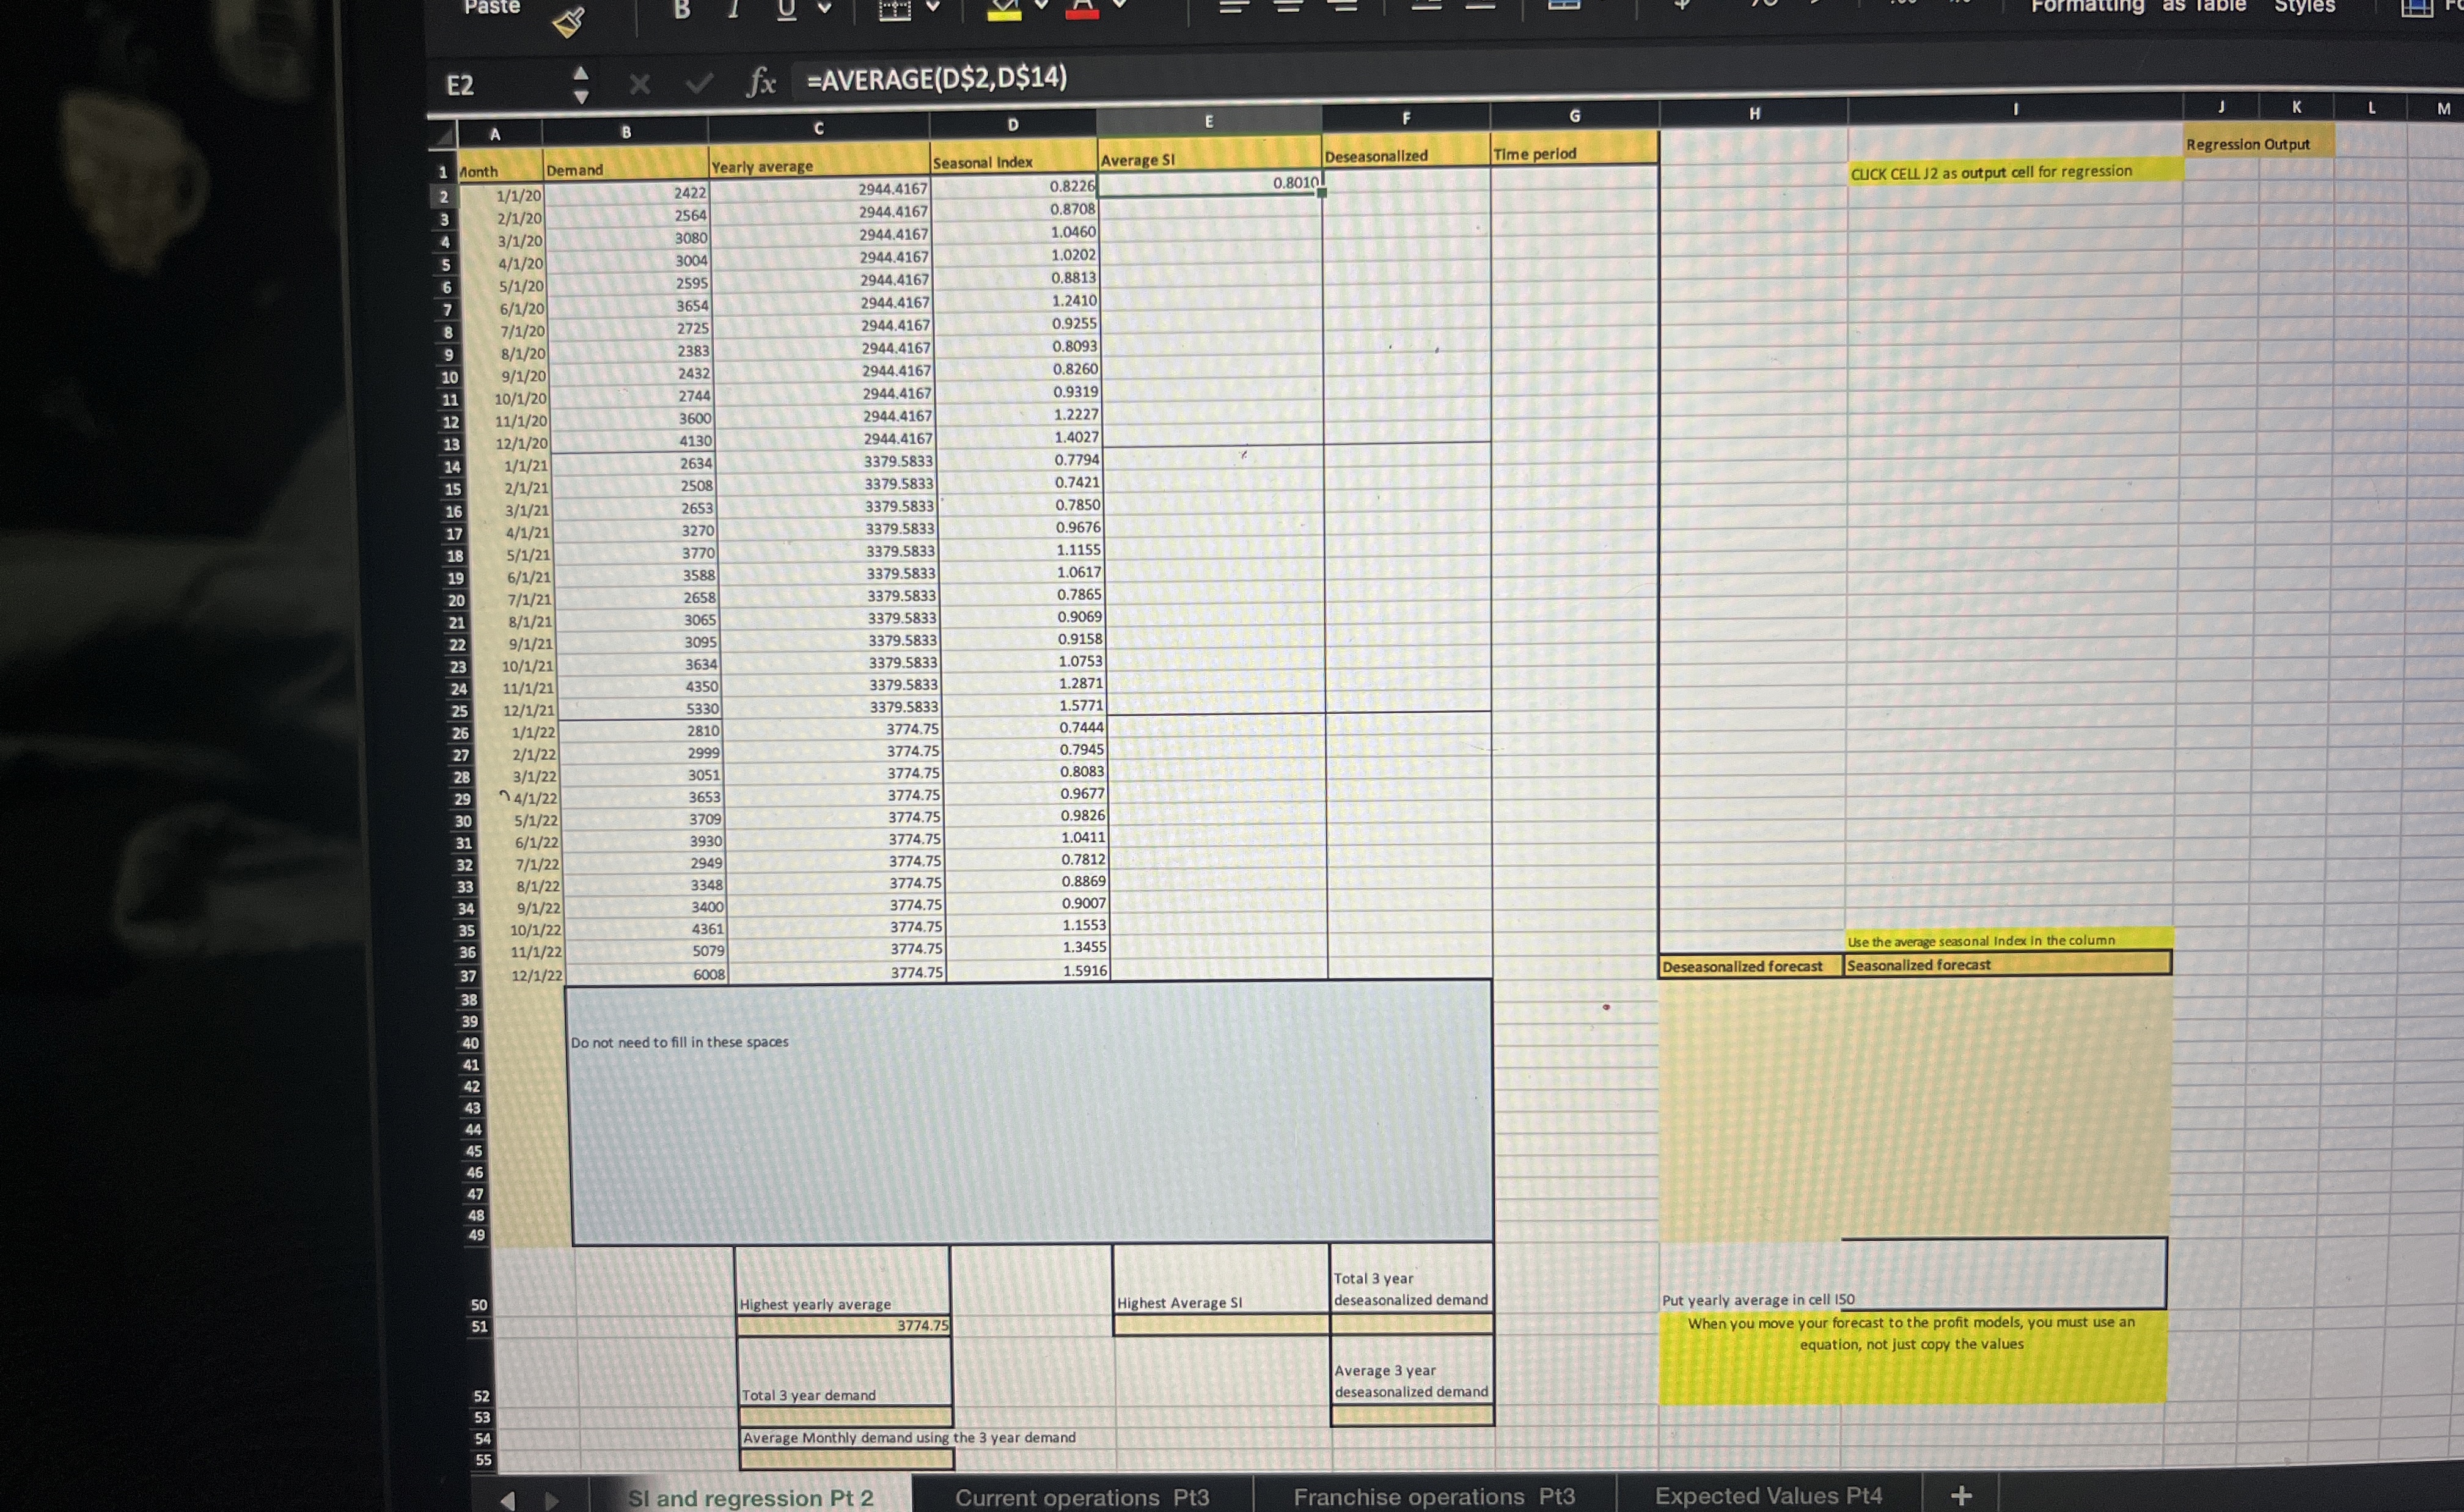
Paste E2 fx fx =AVERAGE(D$2,D$14) 1 Month A Demand B C D E Yearly average Seasonal Index Average SI 2 1/1/20 2422 2944.4167 0.8226 3 2/1/20 2564 2944.4167 0.8708 4 3/1/20 3080 2944.4167 1.0460 5 4/1/20 3004 2944.4167 1.0202 6 5/1/20 2595 2944.4167 0.8813 7 6/1/20 3654 2944.4167 1.2410 8 7/1/20 2725 2944.4167 0.9255 9 8/1/20 2383 2944.4167 0.8093 10 9/1/20 2432 2944.4167 0.8260 11 10/1/20 2744 2944.4167 0.9319 12 11/1/20 3600 2944.4167 1.2227 13 12/1/20 4130 2944.4167 1.4027 14 1/1/21 2634 3379.5833 0.7794 15 2/1/21 2508 3379.5833 0.7421 16 3/1/21 2653 3379.5833 0.7850 17 4/1/21 3270 3379.5833 0.9676 18 5/1/21 3770 3379.5833 1.1155 19 6/1/21 3588 3379.5833 1.0617 20 7/1/21 2658 3379.5833 0.7865 21 8/1/21 3065 3379.5833 0.9069 22 9/1/21 3095 3379.5833 0.9158 23 10/1/21 3634 3379.5833 1.0753 24 11/1/21 4350 3379.5833 1.2871 25 12/1/21 5330 3379.5833 1.5771 26 1/1/22 2810 3774.75 0.7444 27 2/1/22 2999 3774.75 0.7945 28 3/1/22 3051 3774.75 0.8083 29 4/1/22 3653 3774.75 0.9677 30 5/1/22 3709 3774.75 0.9826 31 6/1/22 3930 3774.75 1.0411 32 7/1/22 2949 3774.75 0.7812 33 8/1/22 3348 3774.75 0.8869 34 9/1/22 3400 3774.75 0.9007 35 10/1/22 4361 3774.75 1.1553 36 11/1/22 5079 3774.75 1.3455 37 12/1/22 6008 3774.75 1.5916 38 39 40 Do not need to fill in these spaces 41 42 43 44 45 46 47 48 49 5550 51 || Highest yearly average Highest Average SI 3774.75 52 53 54 Total 3 year demand Average Monthly demand using the 3 year demand 55 SI and regression Pt 2 F G H Time period 0.8010 Deseasonalized ormatting as Table Styles J K M Regression Output CLICK CELL J2 as output cell for regression Deseasonalized forecast Use the average seasonal Index in the column Seasonalized forecast Total 3 year deseasonalized demand Put yearly average in cell 150 When you move your forecast to the profit models, you must use an equation, not just copy the values Average 3 year deseasonalized demand Current operations Pt3 Franchise operations Pt3 Expected Values Pt4 +
Step by Step Solution
There are 3 Steps involved in it

Get step-by-step solutions from verified subject matter experts