

Question: Paste fx The Application of Markowitz Model to International Diversification The Application of Markowitz Model to International Diversification 3 Inputs 1 Forecasts of Risk Premiums
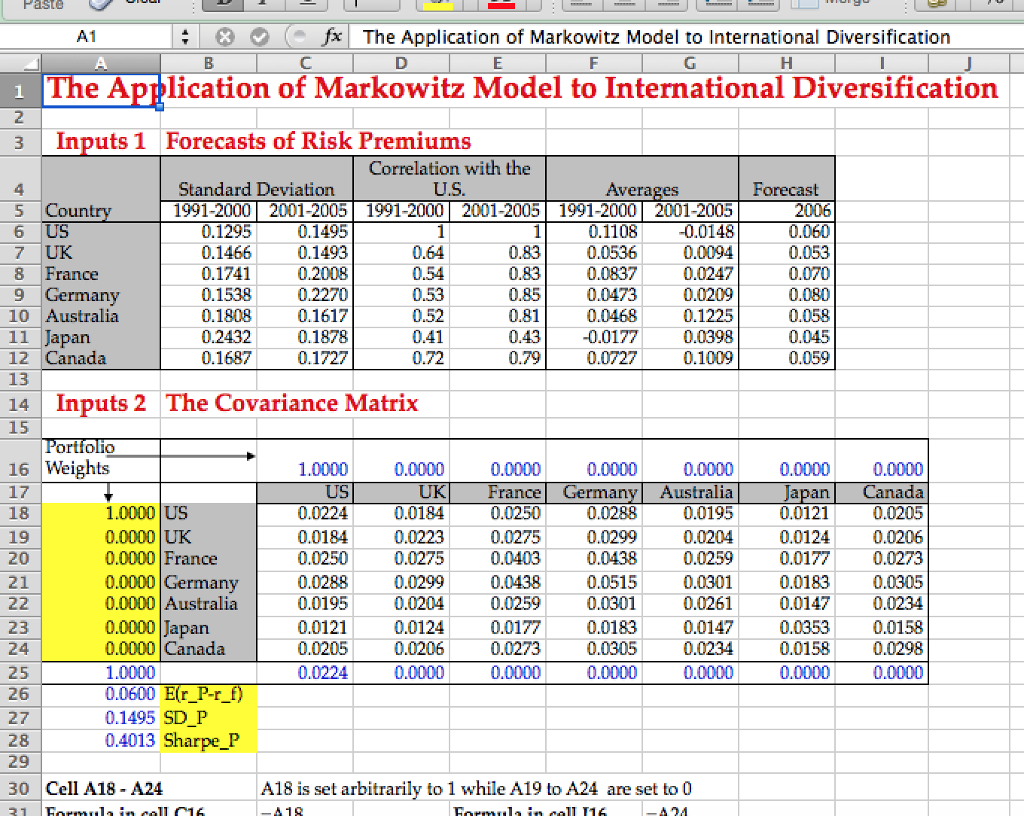
Paste fx The Application of Markowitz Model to International Diversification The Application of Markowitz Model to International Diversification 3 Inputs 1 Forecasts of Risk Premiums Correlation with the Standard Deviation US Averages Forecast 5 Count 1991-2000 2001-2005 1991-2000 2001-2005 1991-2000 2001-2005 2006 0.1295 1 1 0.1108 -0.0148 0.060 US 0.1495 0.1466 0.1493 0.64 0.83 0.0536 0.0094 0.053 0.1741 0.2008 0.54 0.83 0.0837 0.0247 0.070 8 France 0.2270 0.53 0.85 0.0473 0.0209 0.080 Germany 0.1538 0.52 0.81 0.0468 0.1225 0.058 10 Australia 1808 0.1617 0.411 0.43 -0.0177 0.0398 0.045 0.2432 11 Japan 0.1878 0.1687 0.1727 072 0.79 0.0727 0.1009 0.059 12 Canada 14 Inputs 2 The Covariance Matrix Portfolio 16 Weights 1.0000 0.0000 0.0000 0.0000 0.0000 0.0000 0.0000 US UK France Germany Australia Japan Canada 0,0224 0.0184 0.0250 0.0288 0.0195 0.0121 0.0205 18 1.0000 US 0.0184 0.0223 0.0275 0.0299 0.0204 0.0124 0.0206 19 0.0000 UK 0.0000 France 0.0250 0.0275 0.0403 0.0438 0.0259 0.0177 0.0273 20 0.0000 Germany 0.0288 0.0299 0.0438 0.0515 0.0301 0.0183 0.0305 21 0.0195 0.0204 0.0259 0.0301 0.0261 0.0147 0.0234 22 0.0000 Australia 0.0121 0.0124 0.0177 0.0183 0.0147 0.0353 0.0158 0.0000 Japan 23 0.0000 Canada. 0.0205 0.0206 0.0273 0.0305 0.0234 0.0158 0.0298 25 1.0000 0.0224 0.0000 0.0000 0.0000 0.0000 0.0000 0.0000 0.0600 Er P-r f 0.1495 SD P 0.4013 Sharpe P 28 29 A18 is set arbitrarily to 1 while A19 to A24 are set to 0 30 Cell A18 A24 Paste fx The Application of Markowitz Model to International Diversification The Application of Markowitz Model to International Diversification 3 Inputs 1 Forecasts of Risk Premiums Correlation with the Standard Deviation US Averages Forecast 5 Count 1991-2000 2001-2005 1991-2000 2001-2005 1991-2000 2001-2005 2006 0.1295 1 1 0.1108 -0.0148 0.060 US 0.1495 0.1466 0.1493 0.64 0.83 0.0536 0.0094 0.053 0.1741 0.2008 0.54 0.83 0.0837 0.0247 0.070 8 France 0.2270 0.53 0.85 0.0473 0.0209 0.080 Germany 0.1538 0.52 0.81 0.0468 0.1225 0.058 10 Australia 1808 0.1617 0.411 0.43 -0.0177 0.0398 0.045 0.2432 11 Japan 0.1878 0.1687 0.1727 072 0.79 0.0727 0.1009 0.059 12 Canada 14 Inputs 2 The Covariance Matrix Portfolio 16 Weights 1.0000 0.0000 0.0000 0.0000 0.0000 0.0000 0.0000 US UK France Germany Australia Japan Canada 0,0224 0.0184 0.0250 0.0288 0.0195 0.0121 0.0205 18 1.0000 US 0.0184 0.0223 0.0275 0.0299 0.0204 0.0124 0.0206 19 0.0000 UK 0.0000 France 0.0250 0.0275 0.0403 0.0438 0.0259 0.0177 0.0273 20 0.0000 Germany 0.0288 0.0299 0.0438 0.0515 0.0301 0.0183 0.0305 21 0.0195 0.0204 0.0259 0.0301 0.0261 0.0147 0.0234 22 0.0000 Australia 0.0121 0.0124 0.0177 0.0183 0.0147 0.0353 0.0158 0.0000 Japan 23 0.0000 Canada. 0.0205 0.0206 0.0273 0.0305 0.0234 0.0158 0.0298 25 1.0000 0.0224 0.0000 0.0000 0.0000 0.0000 0.0000 0.0000 0.0600 Er P-r f 0.1495 SD P 0.4013 Sharpe P 28 29 A18 is set arbitrarily to 1 while A19 to A24 are set to 0 30 Cell A18 A24
Step by Step Solution
There are 3 Steps involved in it

Get step-by-step solutions from verified subject matter experts