

Question: PCA (Principal Component Analysis), Use Matlab or Python for the implementation. Generate 100 points from a multivariate Normal distribution with u (0 OT and I
PCA (Principal Component Analysis),
Use Matlab or Python for the implementation.
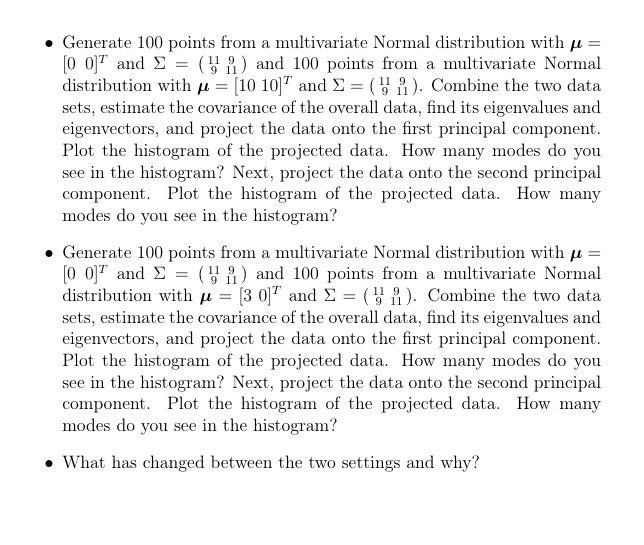
Generate 100 points from a multivariate Normal distribution with u (0 OT and I = ( 1 ) and 100 points from a multivariate Normal distribution with u = (1010)" and = (i). Combine the two data sets, estimate the covariance of the overall data, find its eigenvalues and eigenvectors, and project the data onto the first principal component. Plot the histogram of the projected data. How many modes do you see in the histogram? Next, project the data onto the second principal component. Plot the histogram of the projected data. How many modes do you see in the histogram? Generate 100 points from a multivariate Normal distribution with u = [0 07 and = () and 100 points from a multivariate Normal distribution with u = (3 07 and I = (Hi). Combine the two data sets, estimate the covariance of the overall data, find its eigenvalues and eigenvectors, and project the data onto the first principal component. Plot the histogram of the projected data. How many modes do you see in the histogram? Next, project the data onto the second principal component. Plot the histogram of the projected data. How many modes do you see in the histogram? What has changed between the two settings and why? Generate 100 points from a multivariate Normal distribution with u (0 OT and I = ( 1 ) and 100 points from a multivariate Normal distribution with u = (1010)" and = (i). Combine the two data sets, estimate the covariance of the overall data, find its eigenvalues and eigenvectors, and project the data onto the first principal component. Plot the histogram of the projected data. How many modes do you see in the histogram? Next, project the data onto the second principal component. Plot the histogram of the projected data. How many modes do you see in the histogram? Generate 100 points from a multivariate Normal distribution with u = [0 07 and = () and 100 points from a multivariate Normal distribution with u = (3 07 and I = (Hi). Combine the two data sets, estimate the covariance of the overall data, find its eigenvalues and eigenvectors, and project the data onto the first principal component. Plot the histogram of the projected data. How many modes do you see in the histogram? Next, project the data onto the second principal component. Plot the histogram of the projected data. How many modes do you see in the histogram? What has changed between the two settings and why
Step by Step Solution
There are 3 Steps involved in it

Get step-by-step solutions from verified subject matter experts