

Question: PDE CH1-Assignment.pdf X + X -> G File | C:/Users/Sharon/Downloads/CH1-Assignment.pdf 2 of 2 Q + K7 State whether each of the following variables is categorical
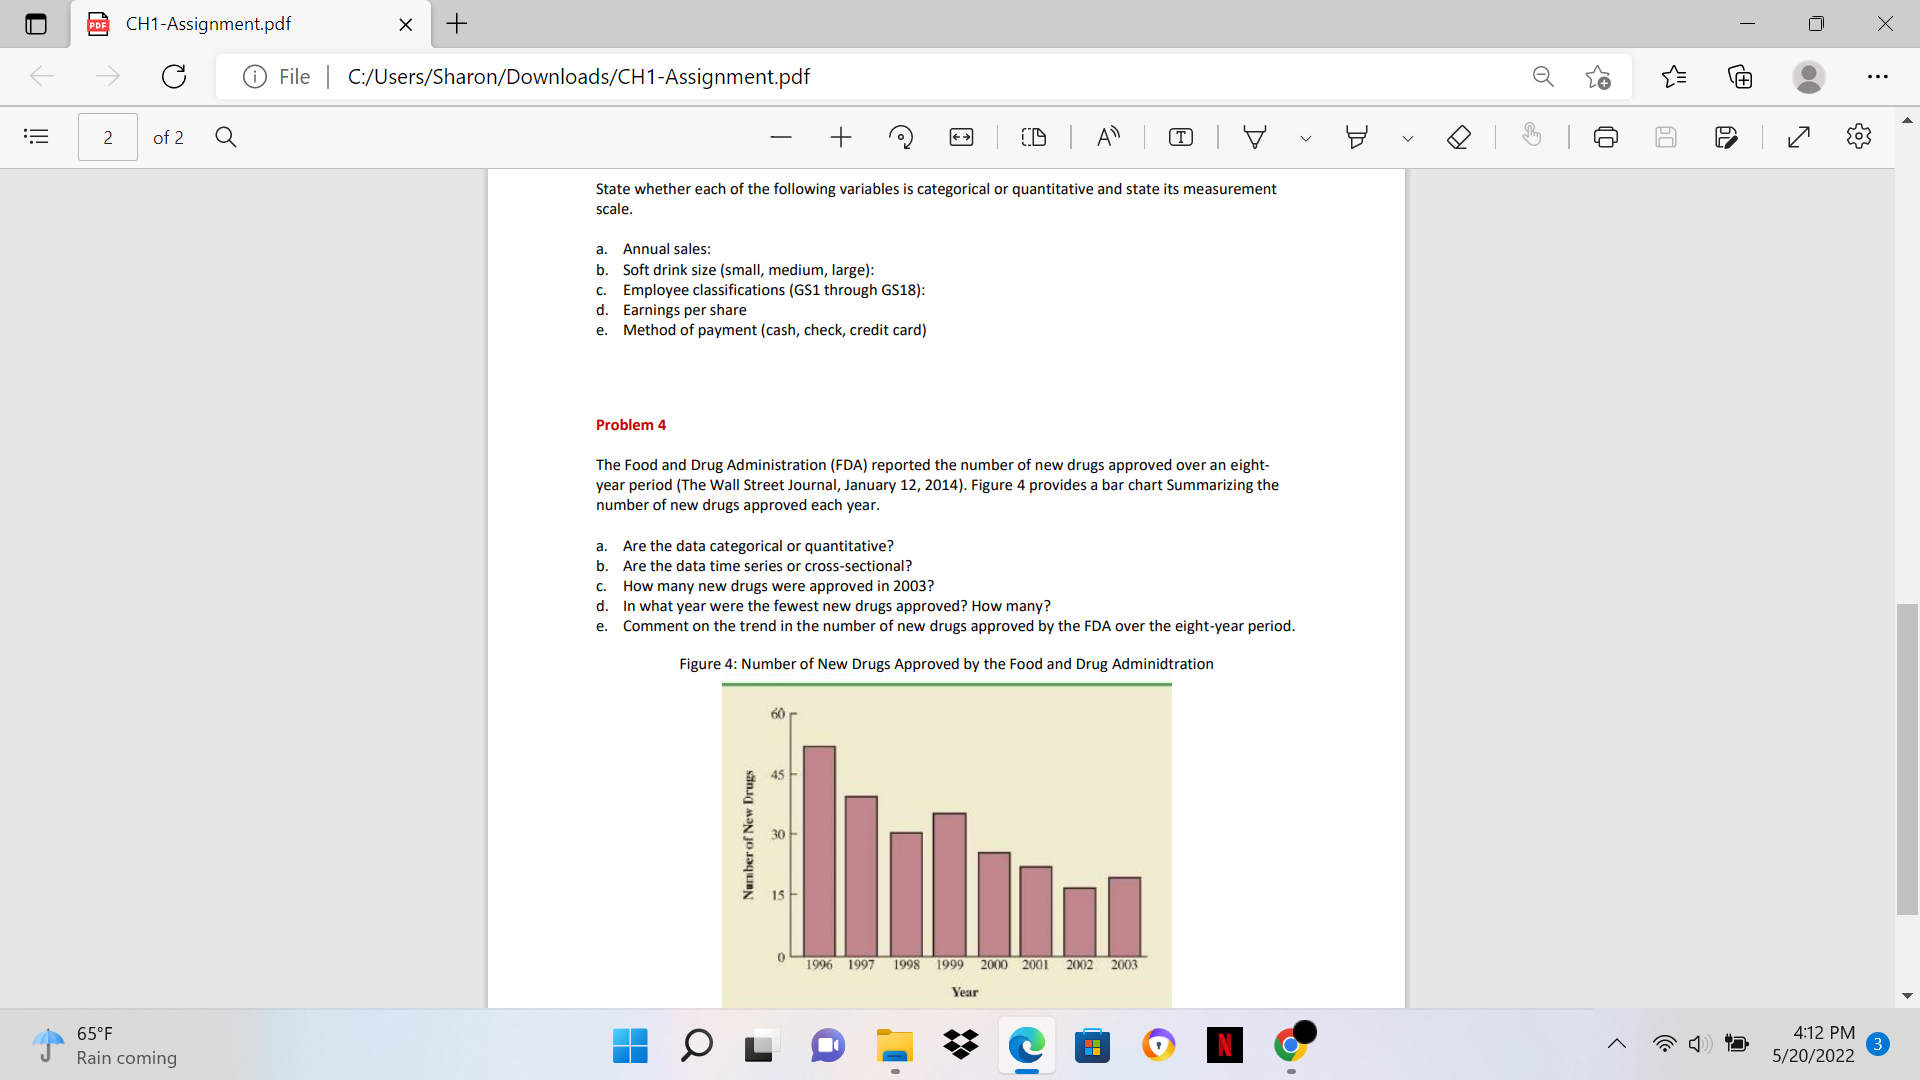
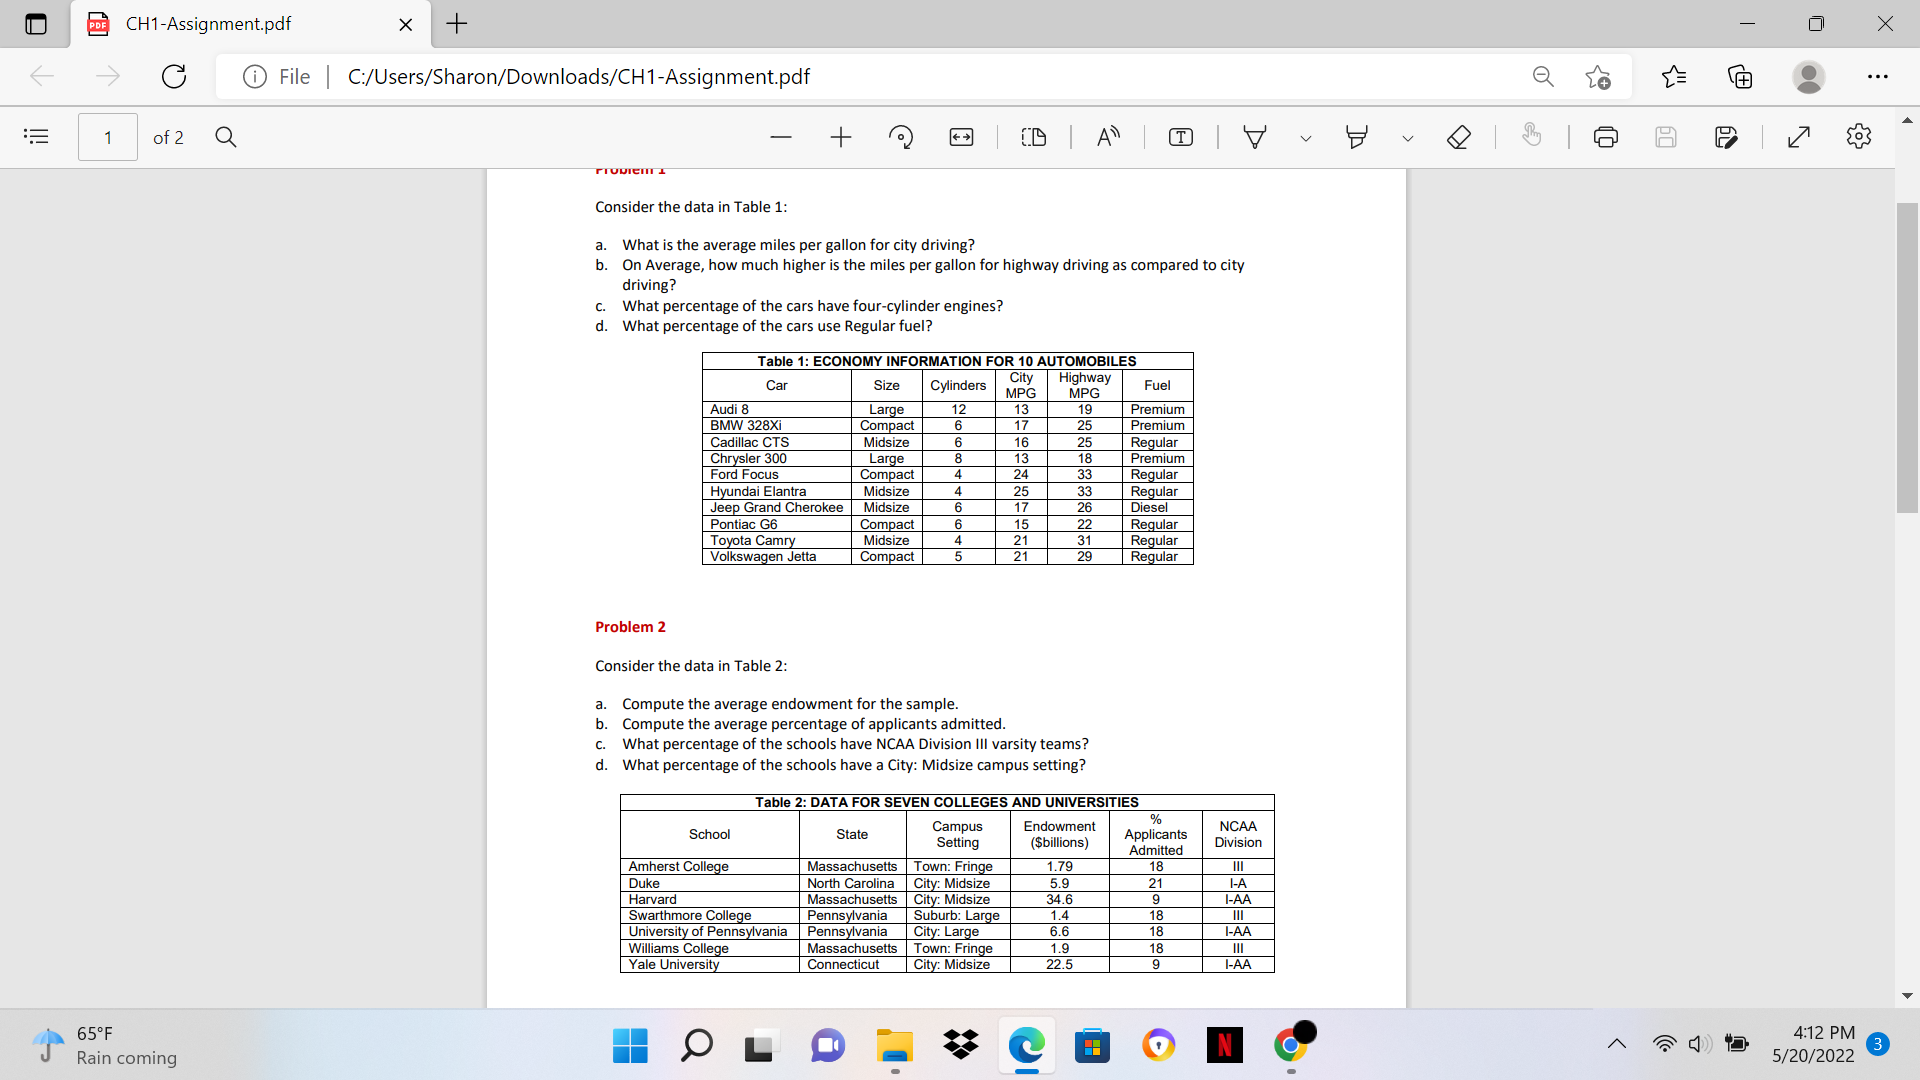
PDE CH1-Assignment.pdf X + X -> G File | C:/Users/Sharon/Downloads/CH1-Assignment.pdf 2 of 2 Q + K7 State whether each of the following variables is categorical or quantitative and state its measurement scale a. Annual sales: b. Soft drink size (small, medium, large): c. Employee classifications (GS1 through GS18): d. Earnings per share e. Method of payment (cash, check, credit card) Problem 4 The Food and Drug Administration (FDA) reported the number of new drugs approved over an eight- year period (The Wall Street Journal, January 12, 2014). Figure 4 provides a bar chart Summarizing the number of new drugs approved each year. a. Are the data categorical or quantitative? Are the data time series or cross-sectional? C. How many new drugs were approved in 2003? In what year were the fewest new drugs approved? How many? e. Comment on the trend in the number of new drugs approved by the FDA over the eight-year period. Figure 4: Number of New Drugs Approved by the Food and Drug Adminidtration 60 45 Number of New Drugs 30 15 OL 1996 1997 1998 1999 2000 2001 2002 2003 Year 65.F OLD O N 4:12 PM 3 Rain coming 5/20/2022PDE CH1-Assignment.pdf X + X -> G File | C:/Users/Sharon/Downloads/CH1-Assignment.pdf . . . 1 of 2 Q + Consider the data in Table 1: a. What is the average miles per gallon for city driving? b. On Average, how much higher is the miles per gallon for highway driving as compared to city driving? C. What percentage of the cars have four-cylinder engines? What percentage of the cars use Regular fuel? Table 1: ECONOMY INFORMATION FOR 10 AUTOMOBILES Car Size Cylinders City Highway MPG Fue MPG Audi 8 Large 13 19 Premium BMW 328Xi Compact 17 25 Premium Cadillac CTS Midsize 16 25 Regular Chrysler 300 Large 13 18 Premium Ford Focus Compact 24 33 Regular Hyundai Elantra Midsize 25 33 Regular Jeep Grand Cherokee Midsize 17 26 Diesel Pontiac G6 Compact 15 22 Regular Toyota Camry Midsize 21 31 Regular Volkswagen Jetta Compact 29 Regular Problem 2 Consider the data in Table 2: a. Compute the average endowment for the sample. b. Compute the average percentage of applicants admitted. c. What percentage of the schools have NCAA Division III varsity teams? d. What percentage of the schools have a City: Midsize campus setting? Table 2: DATA FOR SEVEN COLLEGES AND UNIVERSITIES % School NCAA State Campus Endowment Setting ($billions) Applicants Admitted Division Amherst College Massachusetts | Town: Fringe 1.19 18 Duke North Carolina City: Midsize 5.9 21 I-A Harvard Massachusetts City: Midsize 34.6 I-AA Swarthmore College Pennsylvania Suburb: Large 1.4 University of Pennsylvania | Pennsylvania City: Large 6.6 18 I-AA Williams College Massachusetts | Town: Fringe 1.9 18 III Yale University Connecticut City: Midsize 22.5 I-AA 65.F OLD O 4:12 PM P 3 Rain coming 5/20/2022
Step by Step Solution
There are 3 Steps involved in it

Get step-by-step solutions from verified subject matter experts