Question: PDE Prescriptive Model Group Project X PDE Prescriptive Model Group Project X + X G File | C:/Users/ashsa/Downloads/Prescriptive%20Model%20Group%20Project2%20(3).pdf G . . . of 5 Q
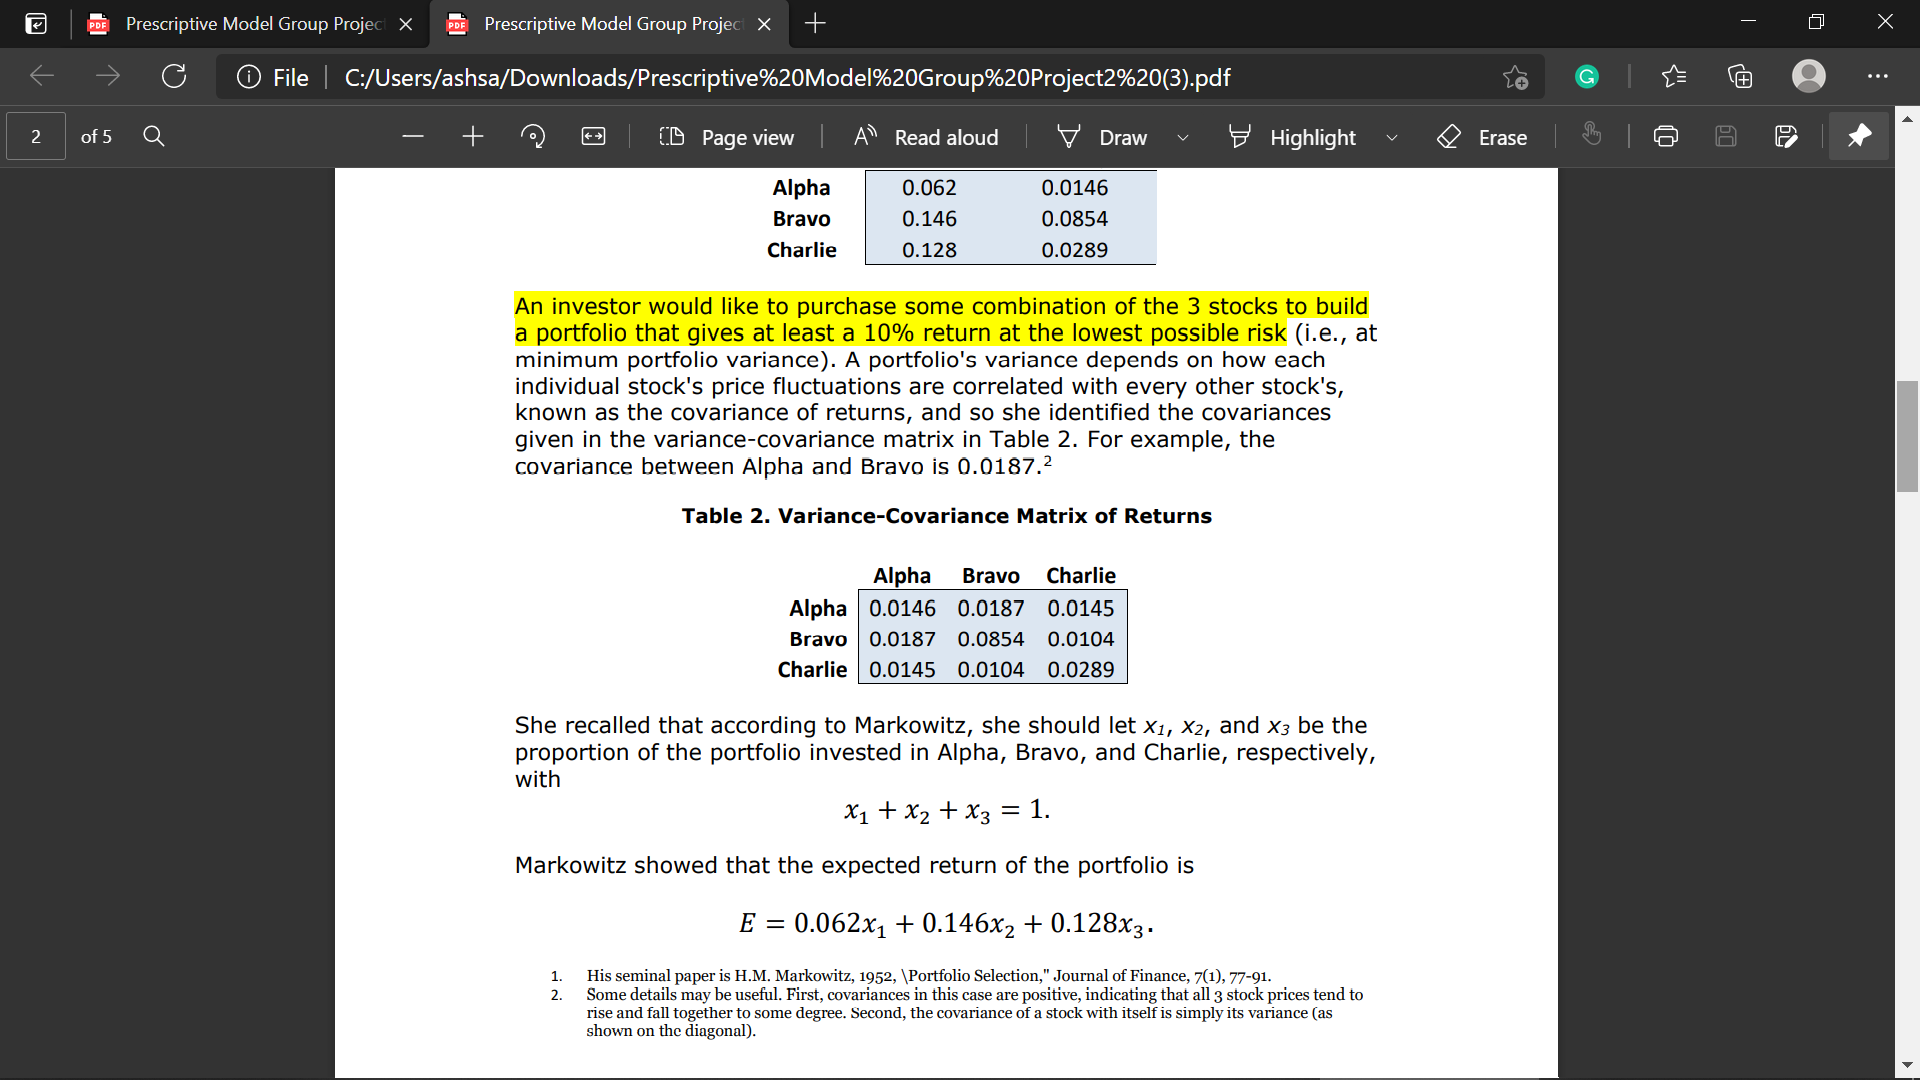
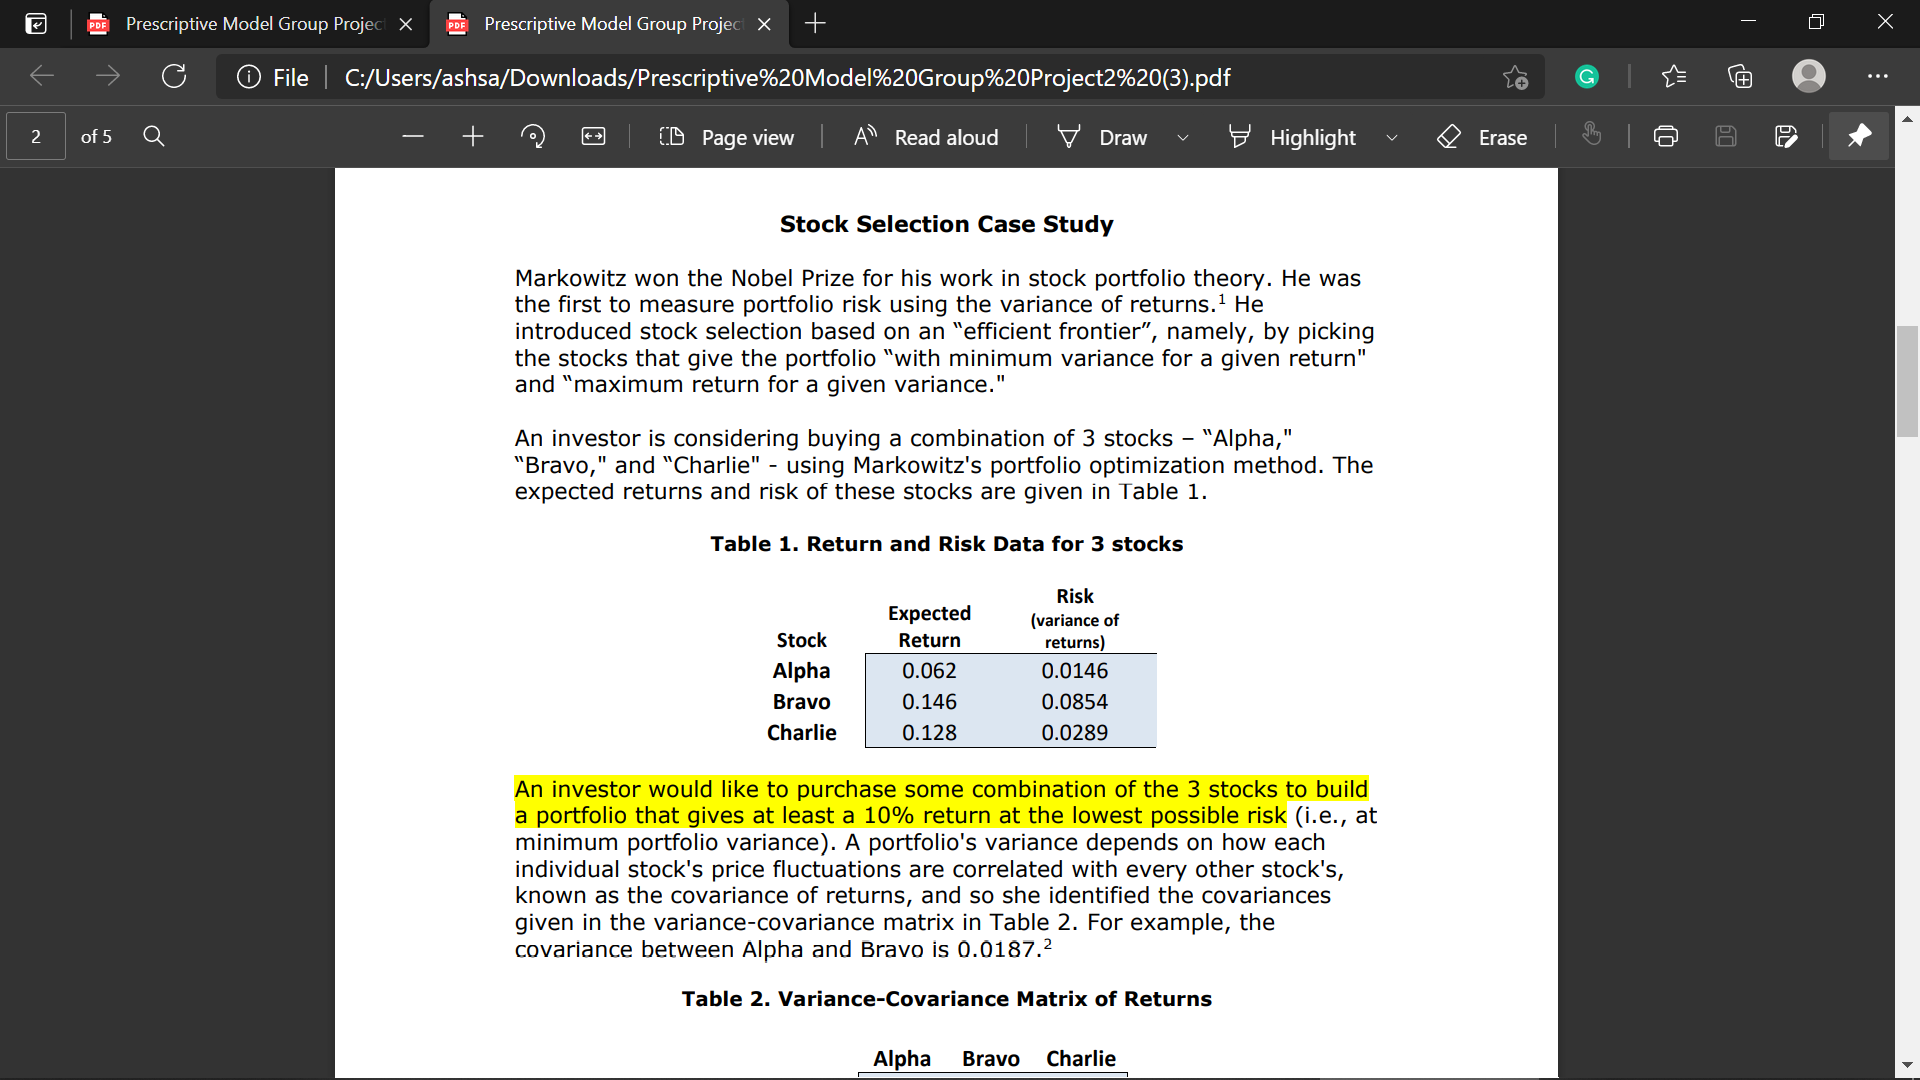
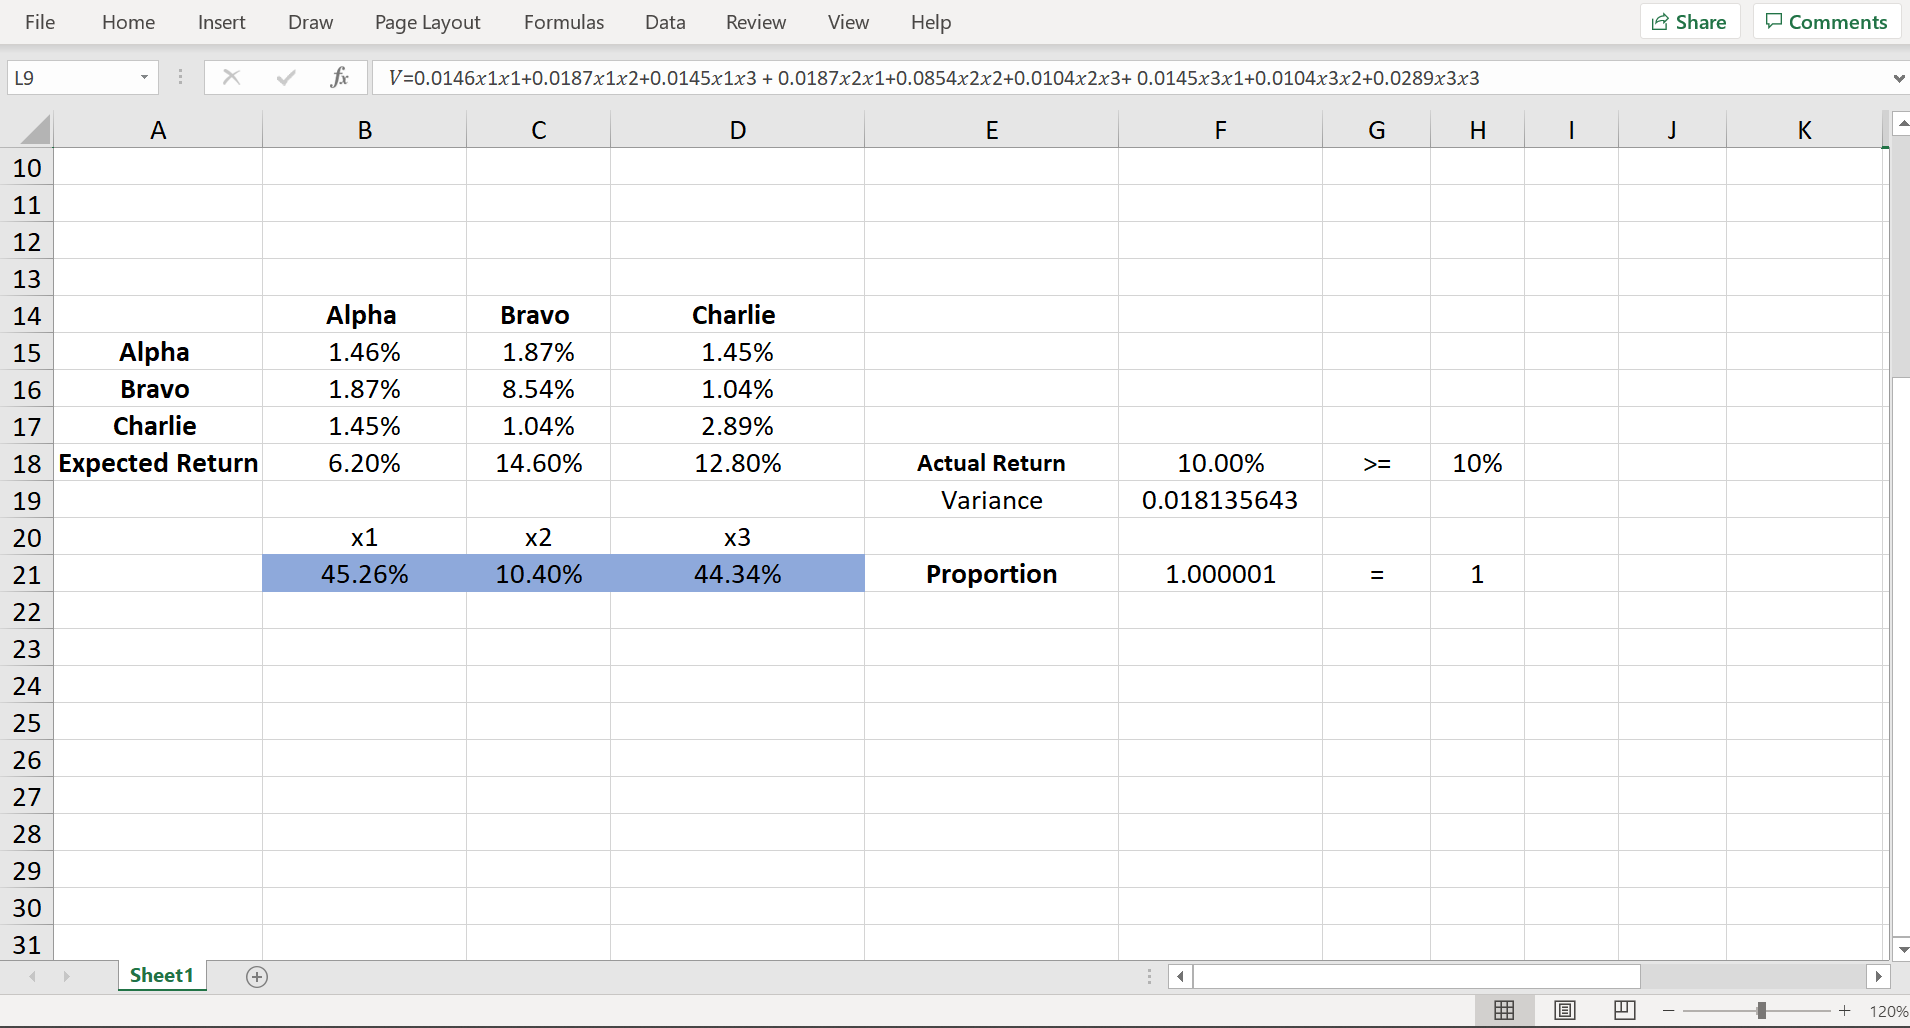
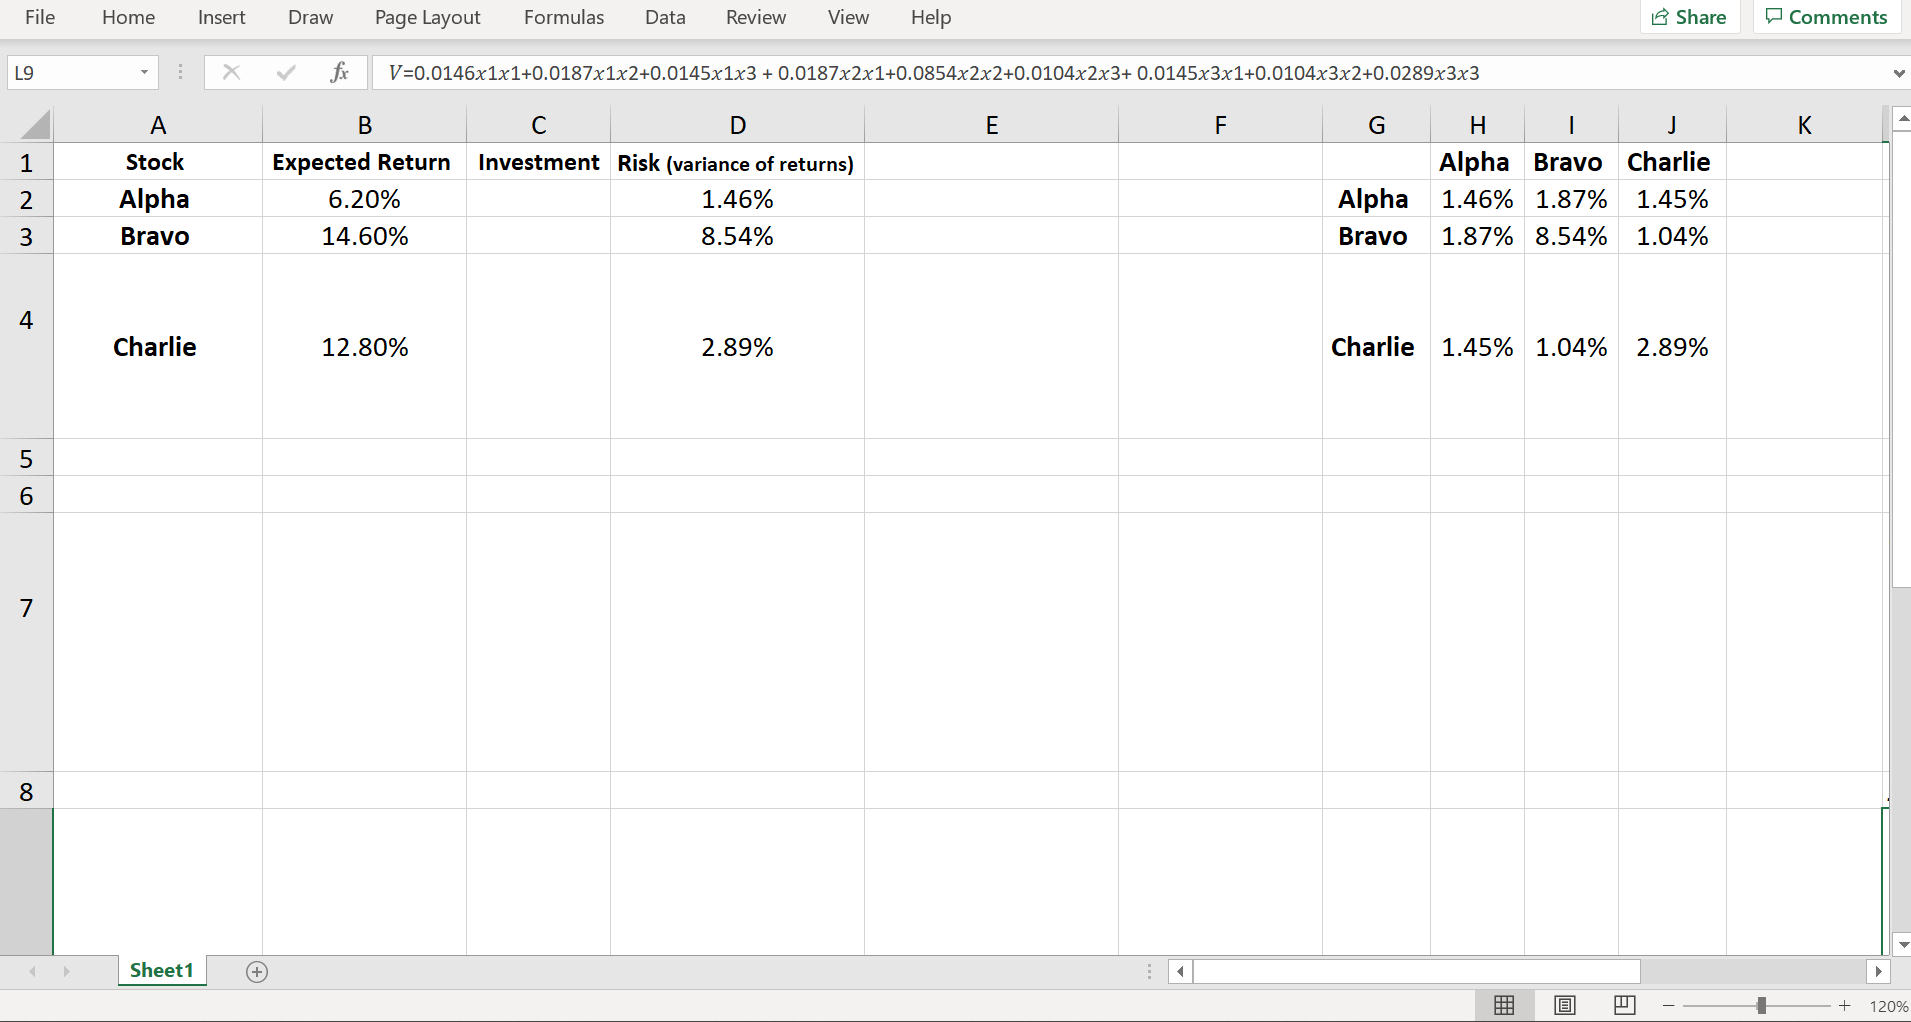
PDE Prescriptive Model Group Project X PDE Prescriptive Model Group Project X + X G File | C:/Users/ashsa/Downloads/Prescriptive%20Model%20Group%20Project2%20(3).pdf G . . . of 5 Q + CD Page view | A Read aloud Draw v Highlight v Erase P Alpha 0.062 0.0146 Bravo 0.146 0.0854 Charlie 0.128 0.0289 An investor would like to purchase some combination of the 3 stocks to build a portfolio that gives at least a 10% return at the lowest possible risk (i.e., at minimum portfolio variance). A portfolio's variance depends on how each individual stock's price fluctuations are correlated with every other stock's, known as the covariance of returns, and so she identified the covariances given in the variance-covariance matrix in Table 2. For example, the covariance between Alpha and Bravo is 0.0187.2 Table 2. Variance-Covariance Matrix of Returns Alpha Bravo Charlie Alpha 0.0146 0.0187 0.0145 Bravo |0.0187 0.0854 0.0104 Charlie | 0.0145 0.0104 0.0289 She recalled that according to Markowitz, she should let X1, X2, and x3 be the proportion of the portfolio invested in Alpha, Bravo, and Charlie, respectively, with X1+ X2 + X3 = 1. Markowitz showed that the expected return of the portfolio is E = 0.062x1 + 0.146X2 + 0.128x3. His seminal paper is H.M. Markowitz, 1952, \\Portfolio Selection," Journal of Finance, 7(1), 77-91. N! Some details may be useful. First, covariances in this case are positive, indicating that all 3 stock prices tend to rise and fall together to some degree. Second, the covariance of a stock with itself is simply its variance (as shown on the diagonal).PDE Prescriptive Model Group Project X PDE Prescriptive Model Group Project X + X G File | C:/Users/ashsa/Downloads/Prescriptive%20Model%20Group%20Project2%20(3).pdf G . . . of 5 Q + [ Page view | A Read aloud Draw v Highlight v Erase P Stock Selection Case Study Markowitz won the Nobel Prize for his work in stock portfolio theory. He was the first to measure portfolio risk using the variance of returns. He introduced stock selection based on an "efficient frontier", namely, by picking the stocks that give the portfolio "with minimum variance for a given return" and "maximum return for a given variance." An investor is considering buying a combination of 3 stocks - "Alpha," "Bravo," and "Charlie" - using Markowitz's portfolio optimization method. The expected returns and risk of these stocks are given in Table 1. Table 1. Return and Risk Data for 3 stocks Risk Expected (variance of Stock Return returns) Alpha 0.062 0.0146 Bravo 0.146 0.0854 Charlie 0.128 0.0289 An investor would like to purchase some combination of the 3 stocks to build a portfolio that gives at least a 10% return at the lowest possible risk (i.e., at minimum portfolio variance). A portfolio's variance depends on how each individual stock's price fluctuations are correlated with every other stock's, known as the covariance of returns, and so she identified the covariances given in the variance-covariance matrix in Table 2. For example, the covariance between Alpha and Bravo is 0.0187.2 Table 2. Variance-Covariance Matrix of Returns Alpha Bravo CharlieFile Home Insert Draw Page Layout Formulas Data Review View Help Share Comments L9 X V V=0.0146x1x1+0.0187x1x2+0.0145x1x3 + 0.0187x2x1+0.0854x2x2+0.0104x2x3+ 0.0145x3x1+0.0104x3x2+0.0289x3x3 A B C D E F G H J K 10 11 12 13 14 Alpha Bravo Charlie 15 Alpha 1.46% 1.87% 1.45% 16 Bravo 1.87% 8.54% 1.04% 17 Charlie 1.45% 1.04% 2.89% 18 Expected Return 6.20% 14.60% 12.80% Actual Return 10.00% >= 10% 19 Variance 0.018135643 20 x1 x2 x3 21 45.26% 10.40% 44.34% Proportion 1.000001 1 22 23 24 25 26 27 28 29 30 31 Sheet1 (+ + 120%File Home Insert Draw Page Layout Formulas Data Review View Help 15 Share Comments L9 X V fx V=0.0146x1x1+0.0187x1x2+0.0145x1x3 + 0.0187x2x1+0.0854x2x2+0.0104x2x3+ 0.0145x3x1+0.0104x3x2+0.0289x3x3 A B C D E F G H K Stock Expected Return Investment Risk (variance of returns) Alpha Bravo Charlie Alpha 6.20% 1.46% Alpha 1.46% 1.87% 1.45% W N Bravo 14.60% 8.54% Bravo 1.87% 8.54% 1.04% 4 Charlie 12.80% 2.89% Charlie 1.45% 1.04% 2.89% 7 8 Sheet1 (+ + 120%