

Question: Pearson Sig x |@ Sign in/ Pas x | @ Pearson Sig x | @ Sign-In Erro x | @ MyLab Prog x | [
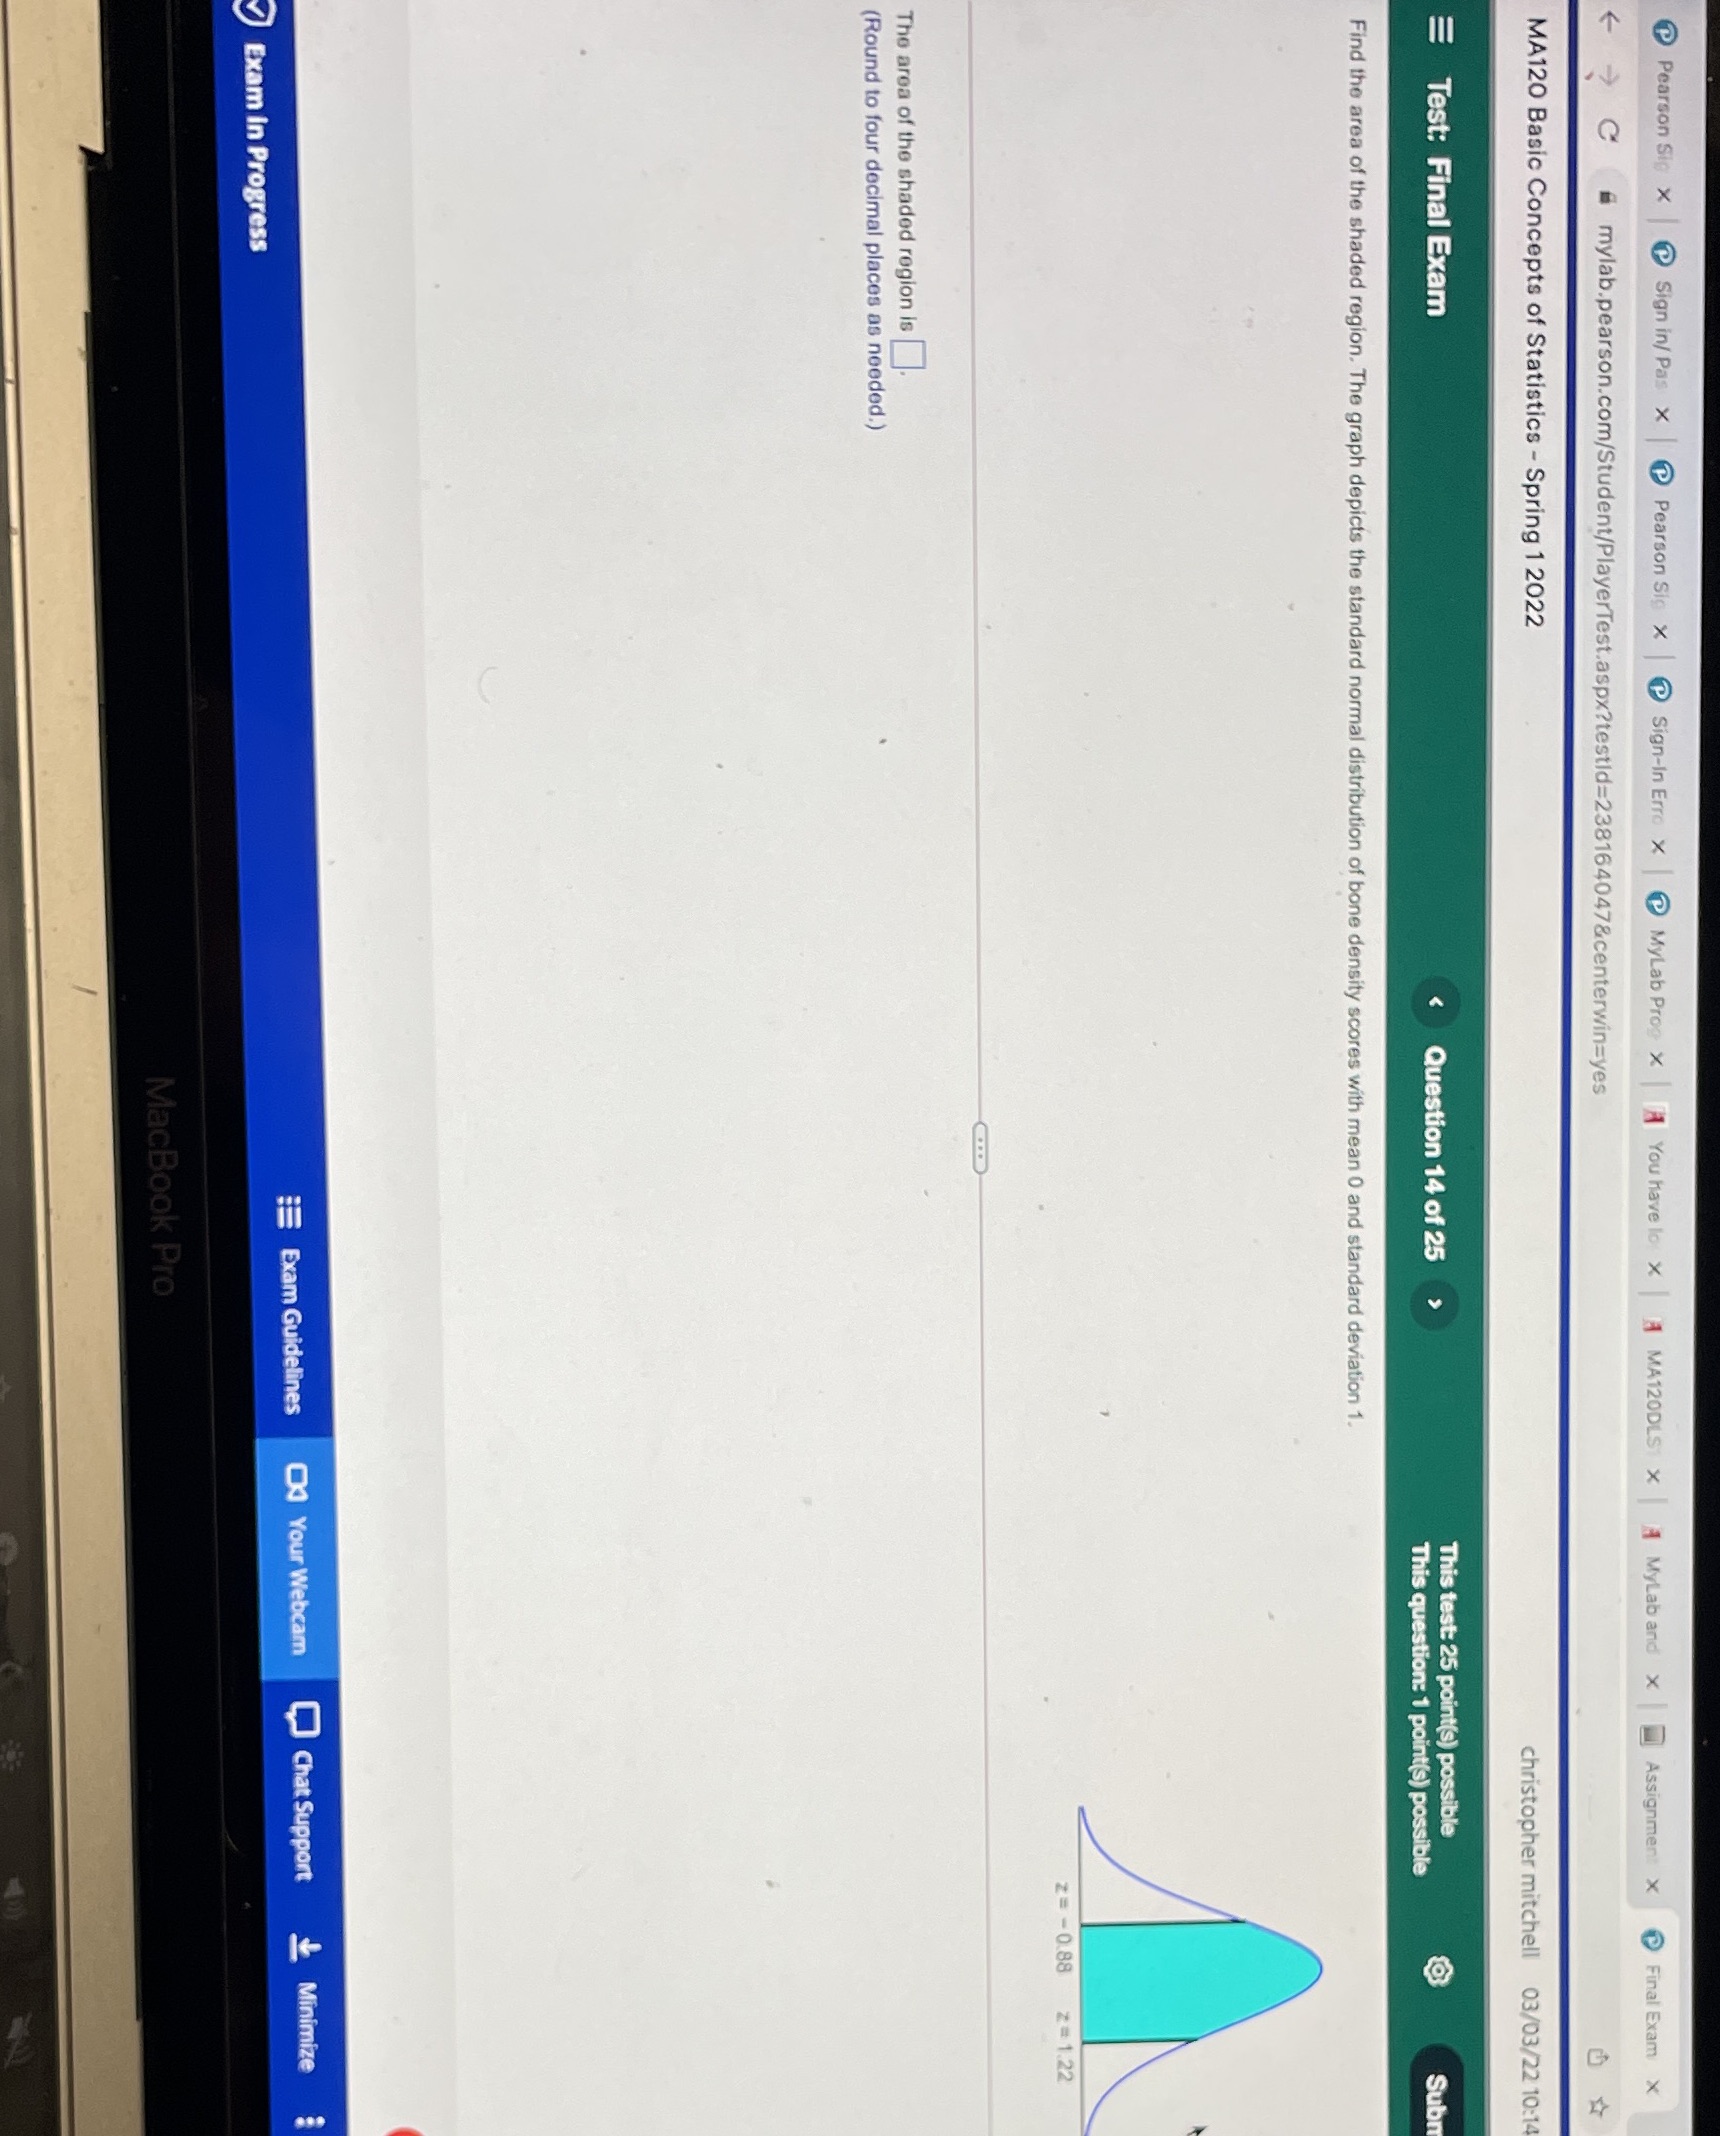

Pearson Sig x |@ Sign in/ Pas x | @ Pearson Sig x | @ Sign-In Erro x | @ MyLab Prog x | [ You have lo X MA120DLS X 1 MyLab and X Assignment X Final Exam X F - C # mylab.pearson.com/Student/PlayerTest.aspx?testid=238164047¢erwin=yes C MA120 Basic Concepts of Statistics - Spring 1 2022 christopher mitchell 03/03/22 10:1 Test: Final Exam Question 14 of 25 > This test: 25 point(s) possible This question: 1 point(s) possible Sub Find the area of the shaded region. The graph depicts the standard normal distribution of bone density scores with mean 0 and standard deviation 1. z= -0.88 z = 1.22 The area of the shaded region is]. (Round to four decimal places as needed.) iExam Guidelines OJ Your Webcam Chat Support & Minimize Exam in Progress MacBook Pro
Step by Step Solution
There are 3 Steps involved in it

Get step-by-step solutions from verified subject matter experts