

Question: Pease how how to do a sensitivity analysis based on changes in revenue and sales to show how they would affect the NPV, IRR, and
Pease how how to do a sensitivity analysis based on changes in revenue and sales to show how they would affect the NPV, IRR, and Payback Period. All calculations are below.
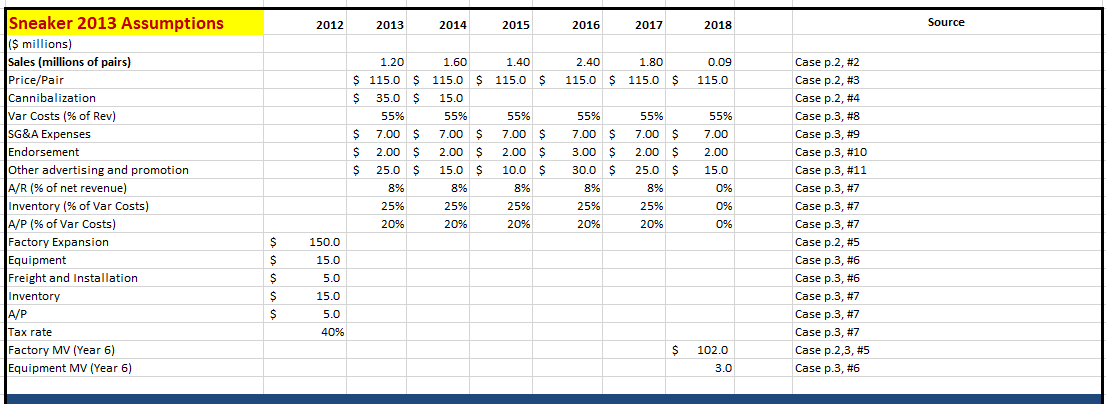
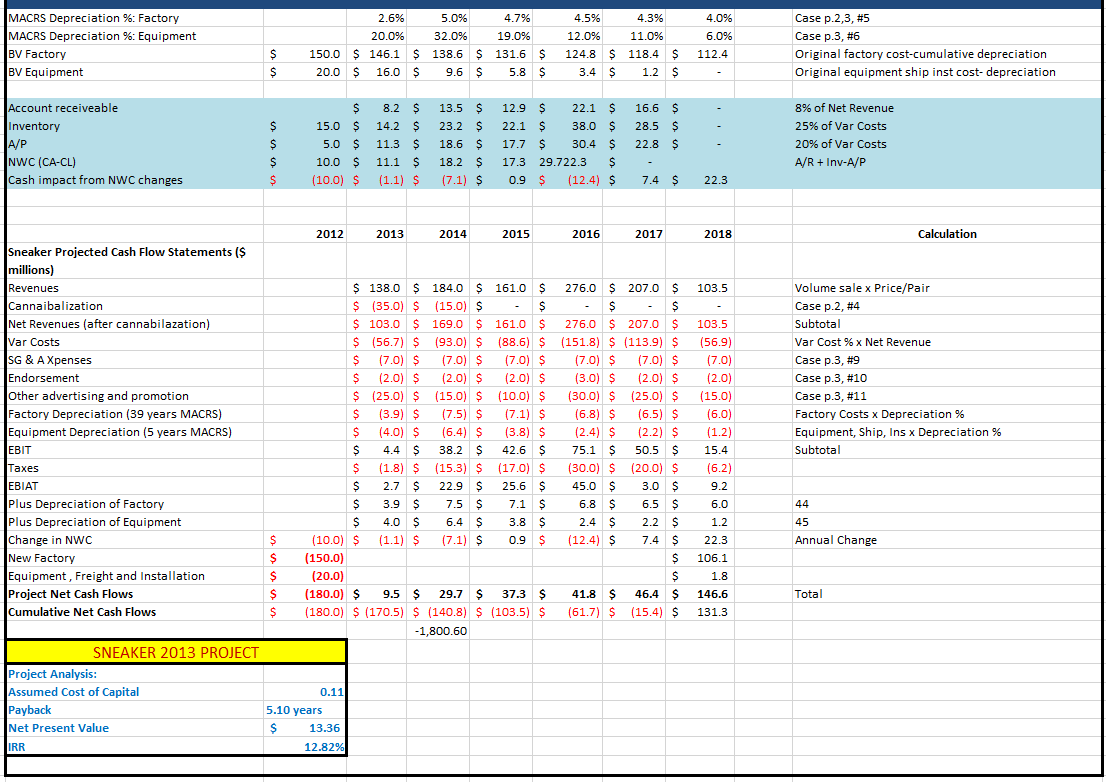
2012 2013 2014 2015 2016 2017 2018 Source 0.09 2.40 1.80 115.0 $ 115.0 $ 115.0 55% Sneaker 2013 Assumptions (s millions) Sales (millions of pairs) Price/Pair Cannibalization Var Costs (% of Rev) SG&A Expenses Endorsement Other advertising and promotion A/R (% of net revenue) Inventory (% of Var Costs) A/P % of Var Costs) Factory Expansion Equipment Freight and Installation Inventory A/P Tax rate Factory MV (Year 6) Equipment MV (Year 6) 1.20 1.60 1.40 $ 115.0 $ 115.0 $ 115.0 $ $ $ 35.0 $ 15.0 55% 55% 55% $ 7.00 $ 7.00 $ 7.00 $ $ 2.00 $ 2.00 $ 2.00 $ $ 25.0 S 15.0 $ 10.0 S 8% 8% 8% 25% 25% 25% 20% 20% 20% 55% 7.00 S 3.00 $ 30.0 $ 8% 25% 20% 55% 7.00 $ 2.00 $ 25.0 $ 8% 25% 7.00 2.00 15.0 0% 0% Case p.2, #2 Case p.2, #3 Case p.2, #4 Case p.3, #8 Case p.3, #9 Case p.3, #10 Case p.3, #11 Case p.3, #7 Case p.3, #7 Case p.3, #7 Case p.2, #5 Case p.3, #6 Case p.3, #6 Case p.3, #7 Case p.3, #7 Case p.3, #7 Case p.2,3, #5 Case p.3, #6 20% 0% 150.0 $ S $ $ $ 15.0 5.0 15.0 5.0 40% $ 102.0 3.0 MACRS Depreciation %: Factory MACRS Depreciation %: Equipment BV Factory BV Equipment 2.6% 5.0% 4.7% 20.0% 32.0% 19.0% 150.0 $ 146.1 $ 138.6 $ 131.6 $ 20.0 S 16.0 $ 9.6 $ 5.8 $ 4.5% 4.3% 12.0% 11.0% 124.8 $ 118.4 $ 3.4 $ 1.2 $ 4.0% 6.0% 112.4 Case p.2,3, #5 Case p.3, #6 Original factory cost-cumulative depreciation Original equipment ship inst cost- depreciation $ $ - Account receiveable Inventory A/P INWC (CA-CL) Cash impact from NWC changes $ $ $ $ $ $ 15.0 $ 5.0 $ 10.0 $ (10.0) $ 8.2 $ 14.2 $ 11.3 $ 11.1 $ (1.1) $ 13.5 $ 23.2 $ 18.6 $ 18.2 $ (7.1) $ 12.9 $ 22.1 S 22.1 $ 38.0 $ 17.7 $ 30.4 $ 17.3 29.722.3 $ 0.9 $ (12.4) $ 16.6 $ 28.5 $ 22.8 $ - 7.4 $ 8% of Net Revenue 25% of Var Costs 20% of Var Costs A/R + Inv-A/P 22.3 2012 2013 2014 2015 2016 2017 2018 Calculation 103.5 Sneaker Projected Cash Flow Statements ($ millions) Revenues Cannaibalization Net Revenues (after cannabilazation) Var Costs SG & A Xpenses Endorsement Other advertising and promotion Factory Depreciation (39 years MACRS) Equipment Depreciation (5 years MACRS) EBIT Taxes EBIAT Plus Depreciation of Factory Plus Depreciation of Equipment Change in NWC New Factory Equipment, Freight and Installation Project Net Cash Flows Cumulative Net Cash Flows $ 138.0 $ 184.0 $ 161.0 $ 276.0 $ 207.0 $ $ (35.0) $ (15.0) $ $ $ $ $ 103.0 $ 169.0 $ 161.0 $ 276.0 $ 207.0 $ $ (56.7) $ (93.0) $ (88.6) $ (151.8) $ (113.9) $ $ (7.0) $ (7.0) $ (7.0) $ (7.0) $ (7.0) $ $ (2.0) $ (2.0) $ (2.0) $ (3.0) $ (2.0) $ $ (25.0) $ (15.0) $ (10.0) $ (30.0) $ (25.0) $ $ (3.9) $ (7.5) $ (7.1) $ (6.8) $ (6.5) $ $ (4.0) $ (6.4) $ (3.8) $ (2.4) $ (2.2) $ $ 4.4 $ 38.2 $ 42.6 $ 75.1 $ 50.5 $ $ (1.8) $ (15.3) $ (17.0) $ (30.0) $ (20.0) $ $ 2.7 $ 22.9 $ 25.6 S 45.0 $ 3.0 $ $ 3.9 $ 7.5 $ 7.1 $ 6.8 $ 6.5 $ S 4.0 $ 6.4 $ 3.8 2.4 $ 2.2 $ (10.0) $ (1.1) $ (7.1) $ 0.9 $ (12.4) $ 7.4 S (150.0) $ (20.0) $ (180.0) $ 9.5 $ 29.7 S 37.3 $ 41.8 $ 46.4 5 (180.0) $ (170.5) $ (140.8) $ (103.5) $ (61.7) $ (15.4) $ -1,800.60 Volume sale x Price/Pair Case p.2, #4 Subtotal Var Cost % x Net Revenue Case p.3, #9 Case p.3, #10 Case p.3, #11 Factory Costs x Depreciation % Equipment, Ship, Ins x Depreciation % Subtotal 103.5 (56.9) (7.0) (2.0) (15.0) (6.0) (1.2) 15.4 (6.2) 9.2 6.0 1.2 22.3 106.1 44 45 Annual Change $ $ $ $ $ 1.8 Total 146.6 131.3 SNEAKER 2013 PROJECT Project Analysis: Assumed Cost of Capital Payback Net Present Value IRR 0.11) 5.10 years $ 13.36 12.82% 2012 2013 2014 2015 2016 2017 2018 Source 0.09 2.40 1.80 115.0 $ 115.0 $ 115.0 55% Sneaker 2013 Assumptions (s millions) Sales (millions of pairs) Price/Pair Cannibalization Var Costs (% of Rev) SG&A Expenses Endorsement Other advertising and promotion A/R (% of net revenue) Inventory (% of Var Costs) A/P % of Var Costs) Factory Expansion Equipment Freight and Installation Inventory A/P Tax rate Factory MV (Year 6) Equipment MV (Year 6) 1.20 1.60 1.40 $ 115.0 $ 115.0 $ 115.0 $ $ $ 35.0 $ 15.0 55% 55% 55% $ 7.00 $ 7.00 $ 7.00 $ $ 2.00 $ 2.00 $ 2.00 $ $ 25.0 S 15.0 $ 10.0 S 8% 8% 8% 25% 25% 25% 20% 20% 20% 55% 7.00 S 3.00 $ 30.0 $ 8% 25% 20% 55% 7.00 $ 2.00 $ 25.0 $ 8% 25% 7.00 2.00 15.0 0% 0% Case p.2, #2 Case p.2, #3 Case p.2, #4 Case p.3, #8 Case p.3, #9 Case p.3, #10 Case p.3, #11 Case p.3, #7 Case p.3, #7 Case p.3, #7 Case p.2, #5 Case p.3, #6 Case p.3, #6 Case p.3, #7 Case p.3, #7 Case p.3, #7 Case p.2,3, #5 Case p.3, #6 20% 0% 150.0 $ S $ $ $ 15.0 5.0 15.0 5.0 40% $ 102.0 3.0 MACRS Depreciation %: Factory MACRS Depreciation %: Equipment BV Factory BV Equipment 2.6% 5.0% 4.7% 20.0% 32.0% 19.0% 150.0 $ 146.1 $ 138.6 $ 131.6 $ 20.0 S 16.0 $ 9.6 $ 5.8 $ 4.5% 4.3% 12.0% 11.0% 124.8 $ 118.4 $ 3.4 $ 1.2 $ 4.0% 6.0% 112.4 Case p.2,3, #5 Case p.3, #6 Original factory cost-cumulative depreciation Original equipment ship inst cost- depreciation $ $ - Account receiveable Inventory A/P INWC (CA-CL) Cash impact from NWC changes $ $ $ $ $ $ 15.0 $ 5.0 $ 10.0 $ (10.0) $ 8.2 $ 14.2 $ 11.3 $ 11.1 $ (1.1) $ 13.5 $ 23.2 $ 18.6 $ 18.2 $ (7.1) $ 12.9 $ 22.1 S 22.1 $ 38.0 $ 17.7 $ 30.4 $ 17.3 29.722.3 $ 0.9 $ (12.4) $ 16.6 $ 28.5 $ 22.8 $ - 7.4 $ 8% of Net Revenue 25% of Var Costs 20% of Var Costs A/R + Inv-A/P 22.3 2012 2013 2014 2015 2016 2017 2018 Calculation 103.5 Sneaker Projected Cash Flow Statements ($ millions) Revenues Cannaibalization Net Revenues (after cannabilazation) Var Costs SG & A Xpenses Endorsement Other advertising and promotion Factory Depreciation (39 years MACRS) Equipment Depreciation (5 years MACRS) EBIT Taxes EBIAT Plus Depreciation of Factory Plus Depreciation of Equipment Change in NWC New Factory Equipment, Freight and Installation Project Net Cash Flows Cumulative Net Cash Flows $ 138.0 $ 184.0 $ 161.0 $ 276.0 $ 207.0 $ $ (35.0) $ (15.0) $ $ $ $ $ 103.0 $ 169.0 $ 161.0 $ 276.0 $ 207.0 $ $ (56.7) $ (93.0) $ (88.6) $ (151.8) $ (113.9) $ $ (7.0) $ (7.0) $ (7.0) $ (7.0) $ (7.0) $ $ (2.0) $ (2.0) $ (2.0) $ (3.0) $ (2.0) $ $ (25.0) $ (15.0) $ (10.0) $ (30.0) $ (25.0) $ $ (3.9) $ (7.5) $ (7.1) $ (6.8) $ (6.5) $ $ (4.0) $ (6.4) $ (3.8) $ (2.4) $ (2.2) $ $ 4.4 $ 38.2 $ 42.6 $ 75.1 $ 50.5 $ $ (1.8) $ (15.3) $ (17.0) $ (30.0) $ (20.0) $ $ 2.7 $ 22.9 $ 25.6 S 45.0 $ 3.0 $ $ 3.9 $ 7.5 $ 7.1 $ 6.8 $ 6.5 $ S 4.0 $ 6.4 $ 3.8 2.4 $ 2.2 $ (10.0) $ (1.1) $ (7.1) $ 0.9 $ (12.4) $ 7.4 S (150.0) $ (20.0) $ (180.0) $ 9.5 $ 29.7 S 37.3 $ 41.8 $ 46.4 5 (180.0) $ (170.5) $ (140.8) $ (103.5) $ (61.7) $ (15.4) $ -1,800.60 Volume sale x Price/Pair Case p.2, #4 Subtotal Var Cost % x Net Revenue Case p.3, #9 Case p.3, #10 Case p.3, #11 Factory Costs x Depreciation % Equipment, Ship, Ins x Depreciation % Subtotal 103.5 (56.9) (7.0) (2.0) (15.0) (6.0) (1.2) 15.4 (6.2) 9.2 6.0 1.2 22.3 106.1 44 45 Annual Change $ $ $ $ $ 1.8 Total 146.6 131.3 SNEAKER 2013 PROJECT Project Analysis: Assumed Cost of Capital Payback Net Present Value IRR 0.11) 5.10 years $ 13.36 12.82%
Step by Step Solution
There are 3 Steps involved in it

Get step-by-step solutions from verified subject matter experts