

Question: Pease use excel to complete this question: This activity is based on the results of a recent study on the safety of airplane drinking water
Pease use excel to complete this question: This activity is based on the results of a recent study on the safety of airplane drinking water that was conducted by the U.S. Environmental Protection Agency (EPA). A study found that out of a random sample of 316 airplanes tested, 40 had coliform bacteria in the drinking water drawn from restrooms and kitchens. As a benchmark comparison, in 2003 the EPA found that about 3.5% of the U.S. population have coliform bacteria-infected drinking water. The question of interest is whether, based on the results of this study, we can conclude that drinking water on airplanes is more contaminated than drinking water in general. Let p be the proportion of contaminated drinking water in airplanes.
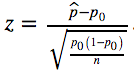
Excel Instructions: Hypothesis Testing for the Population Proportion p To conduct the z-test for the population proportion (p) in Excel, we first need to calculate p-hat, and to do this, we remember that p-hat = x. Now we can calculate the test statistic using Once we have calculated our test statistic (z), we find the probability that p is less than or equal to the test statistic (Z) using the Excel formula =NORMSDIST(z). Since our alternative hypothesis is that p is greater than Z, we then find the p-value that we want by subtracting the value we just calculated from 1.
\f
Step by Step Solution
There are 3 Steps involved in it

Get step-by-step solutions from verified subject matter experts