

Question: Peer Reply #1: Read a classmate's response. Consider investing in your classmate's stock and assume that the daily change is normally distributed. Using the Normal
Peer Reply #1: Read a classmate's response. Consider investing in your classmate's stock and assume that the daily change is normally distributed. Using the Normal Distribution Excel template your classmate's mean and standard deviation, determine the probability for the daily change of this stock to have:
- A decrease of 0.5 point or more (X ? -0.5)?
- An increase of more than 0.5 point (X > 0.5)?
- A decrease of 1 point or more (X ? -1)?
- An increase of more than 1 point (X > 1)?
In your own words, explain if these are high or low likelihoods for change. (Peer's Discussion Post to Reply To)
I chose a fantastic company called Raytheon Technologies (RTX) that is a great dividend stock. This is my own personal opinion of course.
The daily change of RTX from 1 Septemeber 2021, to 14 October 2021 is shown below:
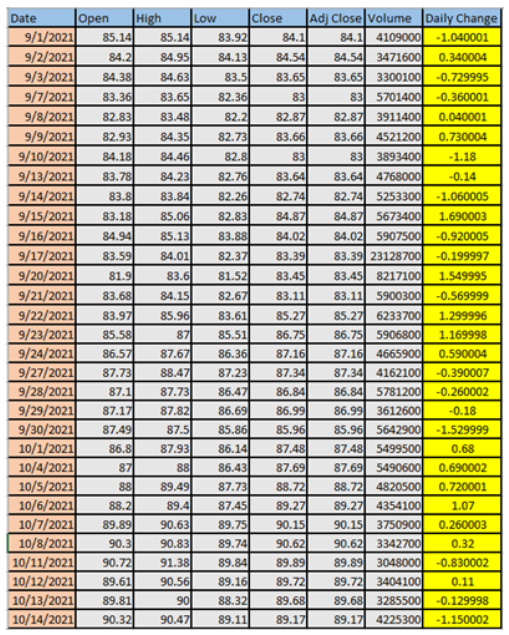
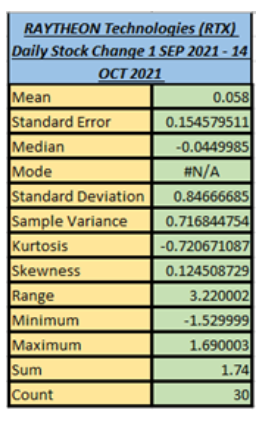
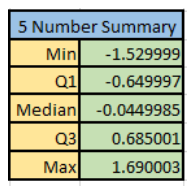
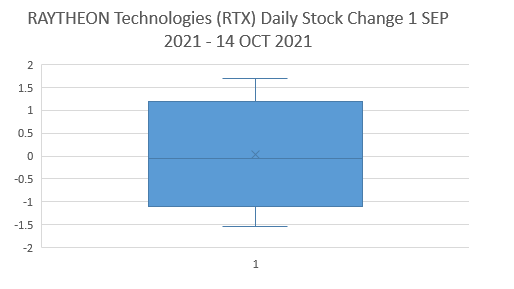
\fRAYTHEON Technologies (RTX] Daily Stock Change 1 SEP 2021 - 14 OCT 2021 Mean 0.058 Standard Error 0.154579511 Median -0.0449985 Mode #N/A Standard Deviation 0.84666685 Sample Variance 0.716844754 Kurtosis -0.720671087 Skewness 0.124508729 Range 3.220002 Minimum -1.529999 Maximum 1.690003 Sum 1.74 Count 305 Number Summary Min -1.529999 Q1 -0.649997 Median - 0.0449985 Q3 0.685001 Max 1.690003RAYTHEON Technologies (RTX) Daily Stock Change 1 SEP 2021 - 14 OCT 2021 2 1.5 1 0.5 0 -0.5 -1 -1.5 -2
Step by Step Solution
There are 3 Steps involved in it

Get step-by-step solutions from verified subject matter experts