

Question: pepsiCo's financial statements are presented in appendix B coca cola company are presented in APPENDIX C determine the following for each company (a1) (a2) (a3)
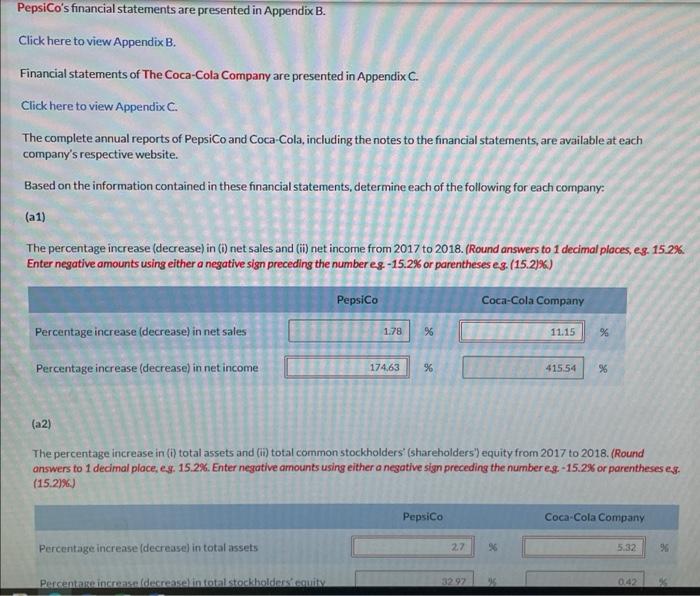
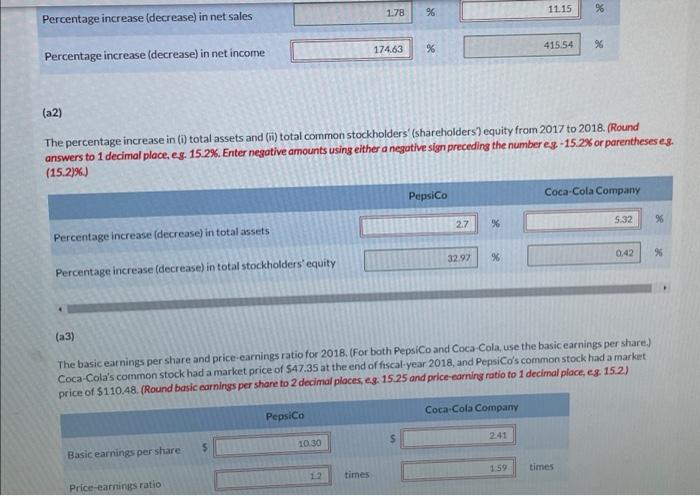
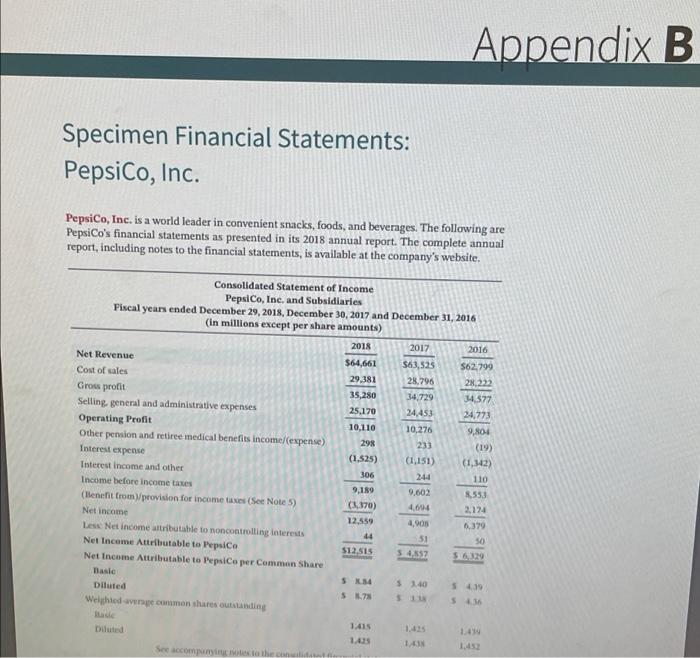
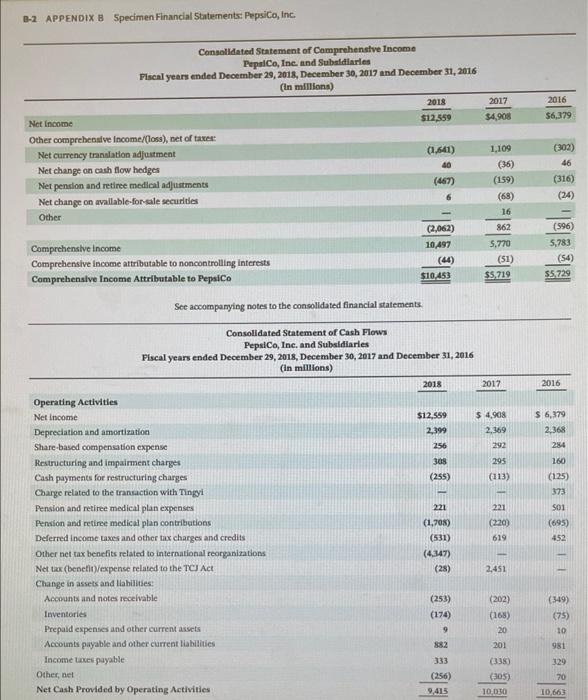
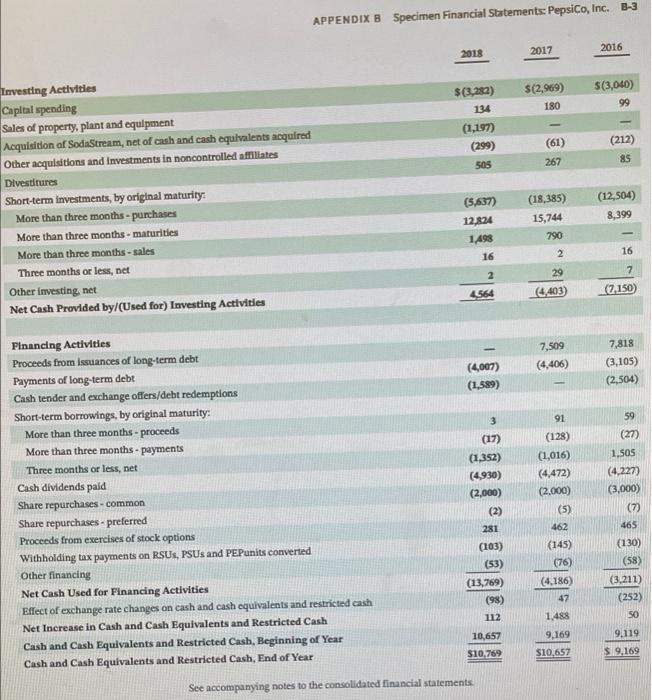
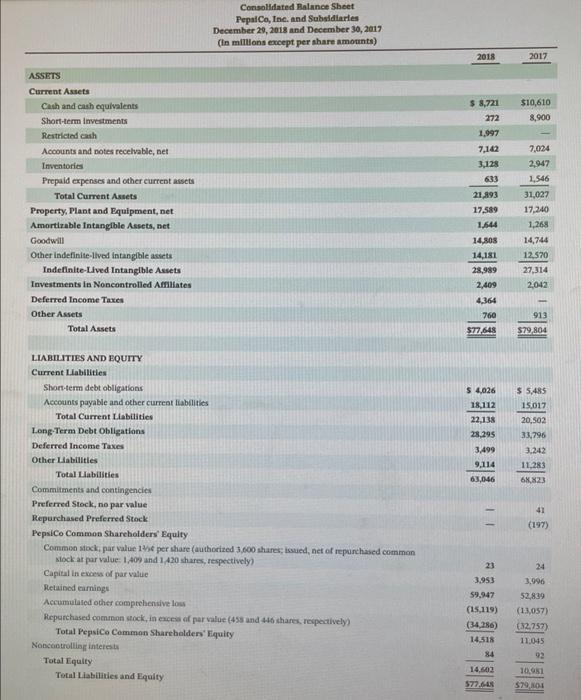
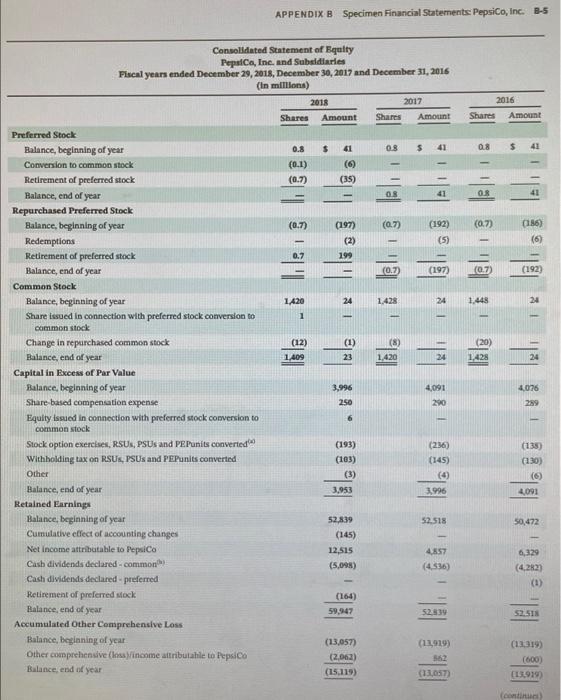
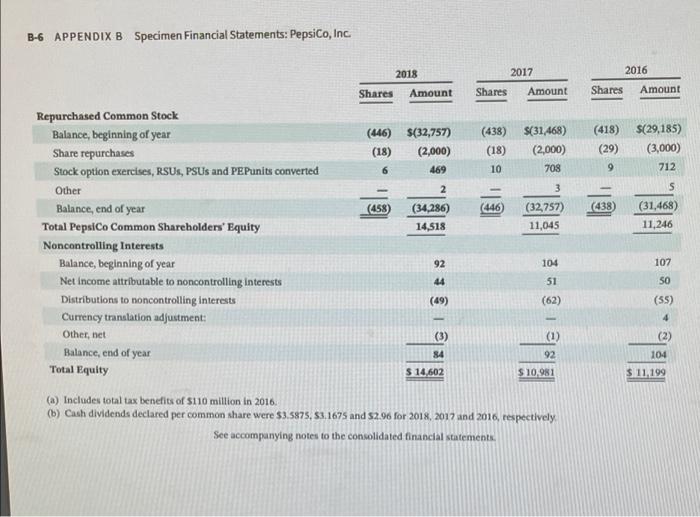
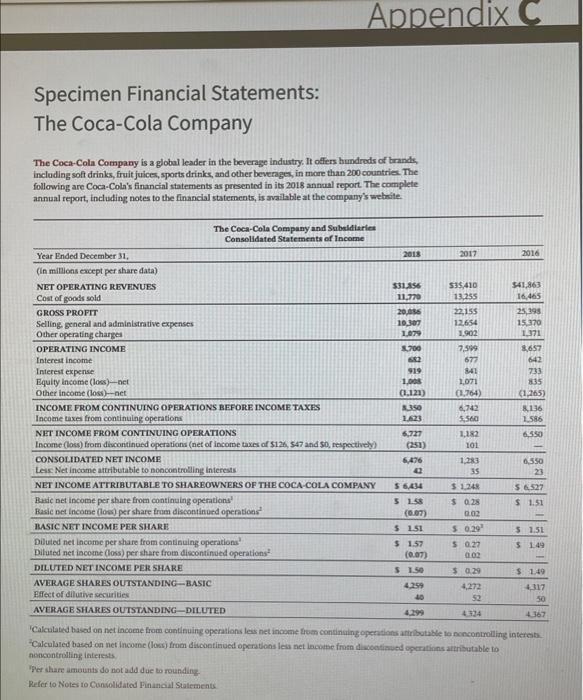
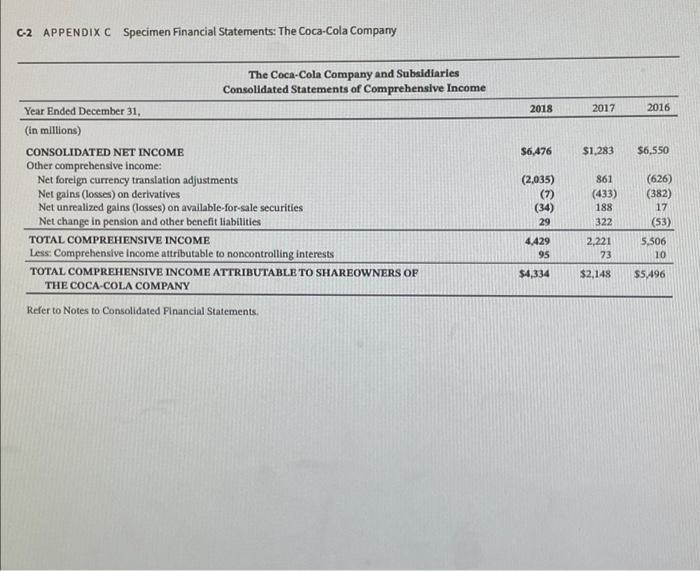
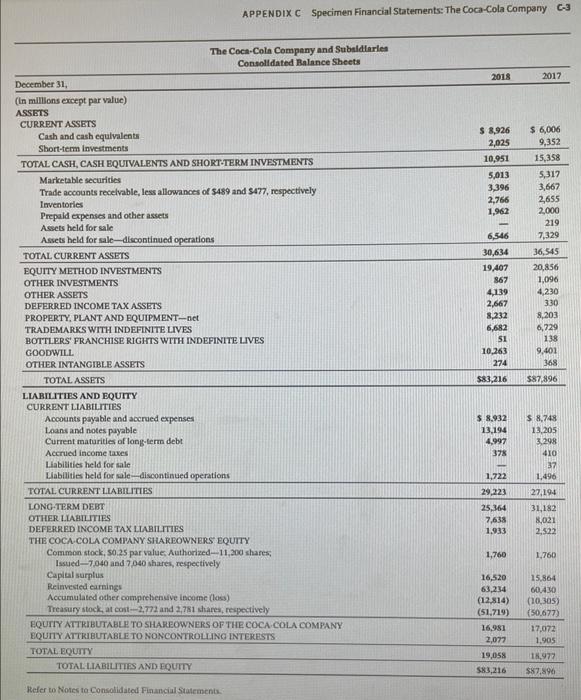
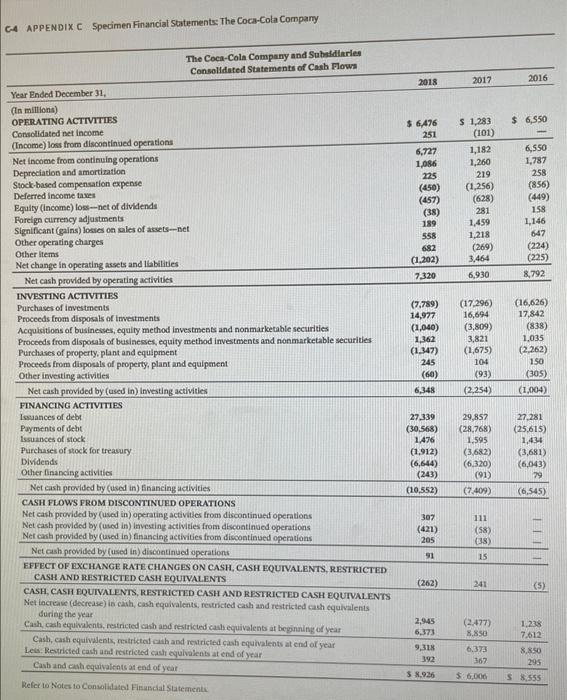
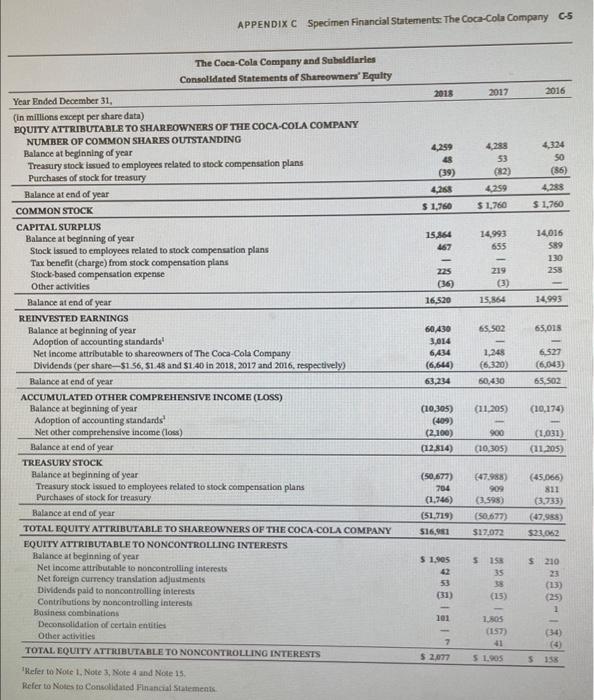
PepsiCo's financial statements are presented in Appendix B. Click here to view Appendix B. Financial statements of The Coca-Cola Company are presented in Appendix C. Click here to view Appendix C. The complete annual reports of PepsiCo and Coca-Cola, including the notes to the financial statements, are available at each company's respective website. Based on the information contained in these financial statements, determine each of the following for each company: (a1) The percentage increase (decrease) in () net sales and () net income from 2017 to 2018. (Round answers to 1 decimal places, eg. 15.2% Enter negative amounts using either a negative sign preceding the number eg.-15.2% or parentheses eg. (15.2%) PepsiCo Coca-Cola Company Percentage increase (decrease) in net sales 1.78 %6 11.15 %6 Percentage increase (decrease) in net income 174,63 % 415.54 % (a2) The percentage increase in (i total assets and (i) total common stockholders (shareholders") equity from 2017 to 2018. (Round answers to 1 decimal place, es. 15.2%. Enter negative amounts using either a negative sign preceding the number eg.-15.2% or parentheses es. (15.296.) PepsiCo Coca-Cola Company Percentage increase (decrease in total assets 27 5.32 96 Percentaines decrease in total stockholdersuit 32.92 0.42 1.78 % 11.15 % Percentage increase (decrease) in net sales 174.63 % 415.54 % Percentage increase (decrease) in net income (a2) The percentage increase in (1) total assets and (ii) total common stockholders' (shareholders') equity from 2017 to 2018. (Round answers to 1 decimal place, eg. 15.2%. Enter negative amounts using either a negative sign preceding the number eg -15.2% or parentheseses. (15.2%) Coca-Cola Company PepsiCo 5:32 % 2.7 % Percentage increase (decrease) in total assets 32.97 0.42 % % Percentage increase (decrease) in total stockholders' equity (a3) The basic earnings per share and price-earnings ratio for 2018. (For both PepsiCo and Coca-Cola, use the basic earnings per share.) Coca-Cola's common stock had a market price of $47.35 at the end of fiscal year 2018, and PepsiCo's common stock had a market price of $110.48. (Round basic earnings per share to 2 decimal places, e.g. 15.25 and price earning ratio to 1 decimal place, s. 15.2) Coca-Cola Company PepsiCo S 241 $ 10.30 Basic earnings pershare 1:59 times times Price-earnings ratio Appendix B Specimen Financial Statements: PepsiCo, Inc. PepsiCo, Inc. is a world leader in convenient snacks, foods, and beverages. The following are PepsiCo's financial statements as presented in its 2018 annual report. The complete annual report, including notes to the financial statements, is available at the company's website. Consolidated Statement of Income PepsiCo, Inc. and Subsidiaries Fiscal years ended December 29, 2018, December 30, 2017 and December 31, 2016 (in millions except per share amounts) 2018 2017 2016 Net Revenue $64,661 $63.525 $62.799 Cost of sales 29.381 28,796 28,232 Gross profit 35,280 34.729 34,577 Selling general and administrative expenses 25,170 24,453 24.773 Operating Profit 10,110 10,276 9,804 Other pension and retiree medical benefits income (expense) 298 233 (19) Interest expense (1.525) (1.151) (1,342) Interest income and other 306 244 110 Income before income taxes 9,189 9,602 8.553 (llenefit from provision for income taxes (See Note 5) (3.370) 2,124 Net income 12.559 4,905 6.370 Less Net income attributable to noncontrolling interests 44 51 50 Net Income Attributable to PepsiCo 512,515 54357 Net Income Attributable to PepsiCo per Common Share Basle S 34 $ 140 Dituted 5419 5.78 5 Weighted average con men shares outstanding 1:415 Duted 1.15 1.49 1.4 14 1,45 See accomo B-2 APPENDIX B Specimen Financial Statements: PepsiCo, Inc. 2016 $6,379 (302) 46 Consolidated Statement of Comprehensive Income Pepalco, Inc. and Subsidiaries Fiscal years ended December 29, 2018, December 30, 2017 and December 31, 2016 (In millions) 2018 2017 Net Income $12.559 34.908 Other comprehensive Income/(los), net of taxer: Net currency translation adjustment (1.641) 1,109 Net change on cash flow hedges 40 (36) Net pension and retiree medical adjustments (467) (159) Net change on avallable-for-sale securities (68) Other (2,062) 862 Comprehensive Income 10,497 5.770 Comprehensive income attributable to noncontrolling interests (44) (51) Comprehensive Income Attributable to PepsiCo $10,453 $5,719 See accompanying notes to the consolidated financial statements. (316) (24) 16 (596) 5.783 (54) 55729 2016 $ 6,379 2.368 284 160 (125) 373 S01 Consolidated Statement of Cash Flows PepsiCo, Inc. and Subsidiaries Piscal years ended December 29, 2018, December 30, 2017 and December 31, 2016 (in millions) 2018 2017 Operating Activities Net Income $12.559 $ 4.908 Depreciation and amortization 2,399 2,369 Share-based compensation expense 256 292 Restructuring and impairment charges 308 295 Cash payments for restructuring charges (255) (113) Charge related to the transaction with Tinggi Pension and retiree medical plan expenses 221 221 Pension and retiree medical plan contributions (1,708) (220) Deferred income taxes and other tax charges and credits (531) 619 Other net tax benefits related to international reorganizations (4.347) Net tax (benett/expense related to the TCU ACE (28) 2,451 Change in assets and liabilities Accounts and notes receivable (253) (202) Inventories (174) (168) Prepaid expenses and other current assets 9 20 Accounts payable and other current liabilities 201 Income taxes payable 333 (338 Othernet (256) (805) Net Cash Provided by Operating Activities 9,415 10.030 (695) 452 (349) 075) 10 981 329 70 10,663 10 APPENDIX B Specimen Financial Statements: PepsiCo, Inc. B-3 2018 2016 2017 S(2,969) 180 $(3,040) 99 $(3.282) 134 (1,197) (299) 505 (61) 267 (212) 85 Investing Activities Capltal spending Sales of property, plant and equipment Acquisition of SodaStream, net of cash and cash equivalents acquired Other acquisitions and investments in noncontrolled affiliates Divestitures Short-term investments, by original maturity: More than three months - purchases More than three months - maturities More than three months - sales Three months or less, net Other investing.net Net Cash Provided by/(Used for) Investing Activities (12,504) 8,399 (5,637) 12,824 1,498 16 (18,385) 15,744 790 2 16 7 2 29 (4.403) 4564 (7150 7,509 (4,406) (4,007) (1,589) 7,818 (3,105) (2,504) 59 3 Pinancing Activities Proceeds from Issuances of long-term debt Payments of long-term debt Cash tender and exchange offers/debt redemptions Short-term borrowings, by original maturity: More than three months - proceeds More than three months - payments Three months or less, net Cash dividends pald Share repurchases - common Share repurchases preferred Proceeds from exercises of stock options Withholding tax payments on RSUS, PSUs and PEPunits converted Other financing Net Cash Used for Financing Activities Effect of exchange rate changes on cash and cash equivalents and restricted cash Net Increase in Cash and Cash Equivalents and Restricted Cash Cash and Cash Equivalents and Restricted Cash, Beginning of Year Cash and Cash Equivalents and Restricted Cash, End of Year (17) (1,352) (4,930) (2,000) (2) 281 (103) (53) (13,769) (98) 112 91 (128) (1,016) (4,472) (2.000) (5) 462 (27) 1,505 (4.227) (3.000) (7) 465 (130) (58) (3.211) (252) (145) (76) (4,186) 47 1,488 8 10,657 $10,769 9.169 $10,657 9,119 $ 9,169 See accompanying notes to the consolidated financial statements. Consolidated Balance Sheet Pepalco, Inc. and Subsidiaries December 29, 2018 and December 30, 2017 (in millions except per share amounts) 2018 2017 $ 8,721 272 1,097 $10,610 8,900 7.162 3,128 633 7,024 2,947 1,546 ASSETS Current Assets Cash and cash equivalents Short-term Investments Restricted cash Accounts and notes receivable, net Inventories Prepaid expenses and other current assets Total Current Assets Property, Plant and Equipment, net Amortable intangible Assets, net Goodwill Other indefinite-lived Intangible assets Indefinite-Lived Intangible Assets Investments in Noncontrolled Affiliates Deferred Income Taxes Other Assets Total Assets 21,893 17,589 1.644 14,808 14,181 28,989 2,409 4,364 760 $77.648 31,027 17.240 1,268 14,744 12.570 27,314 2042 913 $79,804 $ 4,026 $ 5,485 15.017 18.112 22,138 28.295 3.499 9.114 63,046 20,502 33,796 3.242 11,283 6,823 LIABILITIES AND EQUITY Current Liabilities Short-term debt obligations Accounts payable and other current liabilities Total Current Liabilities Long Term Debt Obligations Deferred Income Taxes Other Liabilities Total Liabilities Commitments and contingencies Preferred Stock, no par value Repurchased Preferred Stock PepsiCo Common Shareholders' Equity Common stock, par value 1 per share (authorized 3.600 shares, issued, net of repurchased common Alock at par value: 1,409 and 1420 shares, respectively) Capital in excess of par value Retained earnings Accumulated other comprehensive low Repurchased common stock, in exces of par value (455 and 446 shares, respectively) Total PepsiCo Common Shareholders' Equity Non controlling interest Total Equity Total Liabilities and Equity 41 (197) 23 24 3.953 59.947 (15,119) (34 286) 14.518 84 14.502 3.996 52,839 (13,057) (82.757) 11.045 92 10.01 579,00 577-60 APPENDIX B Specimen Financial Statements: PepsiCo, Inc. B-S Consolidated Statement of Equity PepsiCo, Inc. and Subsidiaries Fiscal years ended December 29, 2018, December 30, 2017 and December 31, 2016 (in millions) 2018 Shares Amount 2017 Shares Amount 2016 Share Amount 0.8 $ 08 $ 41 0.8 (0.1) 41 (6) (35) (0.7) 08 41 OR (0.7) (07) (07) (197) (2) 199 (192) (5) (185) (6) - Ele Uge 0.7 (0.7) (197) (0.7) (192) 1.420 24 1.428 24 1.448 24 I (12) 1.409 (1) 23 (8) 1,420 (20) 1.428 24 24 3,996 Preferred Stock Balance, beginning of year Conversion to common stock Retirement of preferred stock Balance, end of year Repurchased Preferred Stock Balance, beginning of year Redemptions Retirement of preferred stock Balance, end of year Common Stock Balance, beginning of year Share issued in connection with preferred stock conversion to common stock Change in repurchased common stock Balance, end of year Capital in Excess of Par Value Balance, beginning of year Share based compensation expense Equity issued in connection with preferred stock conversion to common stock Stock option exercises, RSUS, PSUs and PE.Punits converted Withholding tax on RSUS, PSUs and PEPunits converted Other Balance, end of year Retained Earnings Balance, beginning of year Cumulative effect of accounting changes Net Income attributable to PepsiCo Cash dividends declared-common Cash dividends declared preferred Retirement of preferred stock Balance, end of year Accumulated Other Comprehensive Loss Balance, beginning of year Other comprehensive Clos/income attributable to lepsico Balance, end of year 4,091 200 4076 289 250 6 (135) (130) (193) (103) (3) 3,953 (236) (145) (4) 3,996 4,091 52.518 50,472 52,839 (145) 12,515 (5.09) 4857 (4.536) 6,329 (4.2827 (1) (164) 59,947 52.839 52.518 (13,057) (2,062) (15.119) (1191 582 (13,057 (12.319) (600) (13919 B-6 APPENDIX B Specimen Financial Statements: PepsiCo, Inc 2018 2016 2017 Shares Amount Shares Amount Shares Amount (446) $(32,757) (2,000) 6 469 (18) (438) S(31,468) (18) (2,000) 10 708 (418) (29) 9 $(29,185) (3,000) 712 2 3 (458) (446 (438) (34,286) 14,518 (32,757) 11,045 S (31,468) 11,246 Repurchased Common Stock Balance, beginning of year Share repurchases Stock option exercises, RSUS, PSUs and PEPunits converted Other Balance, end of year Total PepsiCo Common Shareholders' Equity Noncontrolling Interests Balance, beginning of year Net Income attributable to noncontrolling interests Distributions to noncontrolling interests Currency translation adjustment Other, net Balance, end of year Total Equity 92 104 107 51 50 44 (49) (62) (55) 4 (3) 84 $ 14,602 (1) 92 (2) 104 $ 11,199 $ $ 10,981 (a) Includes total tax benefits of S110 million in 2016, (b) Cash dividends declared per common share were $3.5875, 83,1675 and 52.96 for 2018, 2017 and 2016, respectively See accompanying notes to the consolidated financial statements Appendix C . Specimen Financial Statements: The Coca-Cola Company The Coca-Cola Company is a global leader in the beverage industry. It offers hundreds of brands including soft drinks, fruit juices, sports drinks, and other beverages, in more than 200 countries. The following are Coca-Cola's financial statements as presented in its 2018 annual report. The complete annual report, including notes to the financial statements, is available at the company's website The Coca-Cola Company and Subsidiaries Consolidated Statements of Income 2018 2017 2016 535,410 13.255 22155 122654 1,902 $31.356 11,770 20.035 10.307 1079 3.700 52 919 1.005 (1,121) R350 1.623 6,727 7,599 677 341 1,071 01.764) 6,742 5.500 Year Ended December 31, (in millions except per share data) NET OPERATING REVENUES Cost of goods sold GROSS PROFIT Selling general and administrative expenses Other operating charges OPERATING INCOME Interest income Interest expense Equity Income (los)-net Other income (loss-net INCOME FROM CONTINUING OPERATIONS BEFORE INCOME TAXES Income taxes from continuing operations NET INCOME FROM CONTINUING OPERATIONS Income (los) from discontinued operations (net of income taxes of $126, 547 and 50, respectively CONSOLIDATED NET INCOME Less Net income attributable to noncontrolling Interests NET INCOME ATTRIBUTABLE TO SHAREOWNERS OF THE COCA-COLA COMPANY Basic net income per share from continuing operations Basic bet Income (los) per share from discontinued operations BASIC NET INCOME PER SHARE Diluted net income per share from continuing operations Diluted net income (loss) per share from discontinued operations DILUTED NET INCOME PER SHARE AVERAGE SHARES OUTSTANDING-BASIC Effect of dilutive securities AVERAGE SHARES OUTSTANDING DILUTED 541,863 16,465 25.99 15.270 1.371 8,657 642 733 35 (1.265) 8136 1.586 6.550 1,182 101 1.283 35 6476 6,350 23 $ 6,434 $ 1.348 $ 6527 $ 1.51 5 15 $ 0.28 02.02 $ 0.29 $ 1.5 (0.07) $ 1.51 $ 1.57 (0.07) $1.50 $ 149 $ 0.27 01:02 $ 1.49 4.259 10 $ 0.29 4.272 52 4317 50 4.167 Calculated based on net income from continuing operations les net income from continuing operations attributable to encontrolling interest "Calculated based on net income (los) from discontinued operations les net income from discontinued operations attributable to noncontrolling interests "Per share amounts do not add due to rounding Refer to Notes to consolidated Pinancial Statements C-2 APPENDIX C Specimen Financial Statements: The Coca-Cola Company 2018 2017 2016 $6,476 $1,283 $6,550 The Coca-Cola Company and Subsidiaries Consolidated Statements of Comprehensive Income Year Ended December 31, (in millions) CONSOLIDATED NET INCOME Other comprehensive income: Net foreign currency translation adjustments Net gains (losses) on derivatives Net unrealized galns (losses) on available-for-sale securities Net change in pension and other benefit liabilities TOTAL COMPREHENSIVE INCOME Less: Comprehensive Income attributable to noncontrolling interests TOTAL COMPREHENSIVE INCOME ATTRIBUTABLE TO SHAREOWNERS OF THE COCA-COLA COMPANY (2,035) (7) (34) 29 861 (433) 188 322 (626) (382) 17 (53) 4.429 95 2,221 73 5,506 10 $4,334 $2,148 $5,496 Refer to Notes to Consolidated Financial Statements. APPENDIXC Specimen Financial Statements: The Coca-Cola Company C3 The Coca-Cola Company and Subsidiaries Consolidated Balance Sheets 2018 2017 $ 8,926 2,025 10,951 5,013 3,396 2,766 1.962 December 31, (in millions except par value) ASSETS CURRENT ASSETS Cash and cash equivalents Short-term investments TOTAL CASH, CASH EQUIVALENTS AND SHORT-TERM INVESTMENTS Marketable securities Trade accounts receivable, less allowances of $489 and $477, respectively Inventories Prepaid expenses and other assets Assets held for sale Assets held for sale-discontinued operations TOTAL CURRENT ASSETS EQUITY METHOD INVESTMENTS OTHER INVESTMENTS OTHER ASSETS DEFERRED INCOME TAX ASSETS PROPERTY, PLANT AND EQUIPMENT-Det TRADEMARKS WITH INDEFINITE LIVES BOTTLERS' FRANCHISE RIGHTS WITH INDEFINITE LIVES GOODWILL OTHER INTANGIBLE ASSETS TOTAL ASSETS 6,546 30,634 19,407 867 4,119 2,667 8,232 6,682 51 10,263 274 $ 6,006 9,352 15,358 5,317 3,667 2,655 2.000 219 7,329 36, 545 20,856 1,096 4,230 330 8,203 6,729 138 9,401 368 $83,216 $87,896 $ 8.932 13,194 4,997 378 $ 8,748 13,205 36298 410 37 1.496 1,722 29,223 LIABILITIES AND EQUITY CURRENT LIABILITIES Accounts payable and accrued expenses Loans and notes payable Current maturities of long-term debt Accrued income taxes Liabilities held for sale Liabilities held for sale discontinued operations TOTAL CURRENT LIABILITIES LONG-TERM DEBT OTHER LIABILITIES DEFERRED INCOME TAX LIABILITIES THE COCA COLA COMPANY SHAREOWNERS EQUITY Common stock, 30.25 par value Authorized-11,200 shares, Issued-7,040 and 7040 shares, respectively Capital surplus Reinvested earnings Accumulated other comprehensive income (oss) Treasury stock at cost-2.772 and 2,781 shares, respectively EQUITY ATTRIBUTABLE TO SHAREOWNERS OF THE COCA-COLA COMPANY EQUITY ATTRIBUTABLE TO NONCONTROLLING INTERESTS TOTAL EQUITY TOTAL LIABILITIES AND EQUITY 25,364 7,638 1,933 27,194 31,182 8,021 2.522 1,760 1.760 16,520 63,234 (12.814) (51.719) 16,981 2,077 19.058 $83,216 15,864 00.450 (10,305) (50.677) 17,072 1.905 18,977 $87.896 Refer to Notes to consolidated Financial Statement CA APPENDIX C Specimen Financial Statements: The Coca-Cola Company The Coca-Cola Company and Subsidiaries Consolidated Statements of Cash Flows 2018 2017 2016 $ 6,550 $ 6,476 251 6,727 1,086 225 (450) (457) (38) 189 558 682 (1,202) 7,320 $ 1,283 (101) 1,182 1,260 219 (1,256) (628) 281 1.459 1,218 (269) 3,464 6930 6,550 1,787 258 (856) (449) 158 1,146 647 (224) (225) 8,792 Year Ended December 31, (In millions) OPERATING ACTIVITIES Consolidated net income (Income) loss from discontinued operations Net income from continuing operations Depreciation and amortization Stock-based compensation expense Deferred income taxes Equity (income) low-net of dividends Foreign currency adjustments Significant (gains) losses on sales of assets-net Other operating charges Other items Net change in operating assets and liabilities Net cash provided by operating activities INVESTING ACTIVITIES Purchases of investments Proceeds from disposals of investments Acquisitions of businesses, equity method investments and nonmarketable securities Proceeds from disposals of businesses, equity method investments and nonmarketable securities Purchases of property, plant and equipment Proceeds from disposals of property, plant and equipment Other investing activities Net cash provided by (used in) Investing activities FINANCING ACTIVITIES Issuances of debt Payments of debt Issuances of stock Purchases of stock for treasury Dividends Other financing activities Net cash provided by used in financing activities CASH FLOWS FROM DISCONTINUED OPERATIONS Net cash provided by used in) operating activities from discontinued operations Net cash provided by (used in) Investing activities from discontinued operations Net cash provided by used in financing activities from discontinued operations Net cash provided by used in discontinued operations EFFECT OF EXCHANGE RATE CHANGES ON CASH, CASH EQUIVALENTS, RESTRICTED CASH AND RESTRICTED CASH EQUIVALENTS CASH, CASH EQUIVALENTS, RESTRICTED CASH AND RESTRICTED CASH EQUIVALENTS Net increase (decrease in cash, cash equivalents, restricted cash and restricted cash equivalents during the year Cash, cash equivalents, restricted cash and restricted cash equivalents at beginning of year Cash, cash equivalents, restricted cash and restricted cash equivalents at end of year Les Restricted cash and restricted cash equivalents at end of year Cash and cash equivalents at end of year (7.789) 14,977 (1,040) 1.362 (1.347) 245 (60) 6,348 (17.296) 16,694 (3,809) 3,821 (1,675) 104 (93) (2.254) (16,626) 17,842 (838) 1,035 (2,262) 150 (305) (1.004) 27.339 (30.568) 1.476 (1.912) (6,644) (243) (10,552) 29,857 (28,768) 1.595 (3,682) (6.320) (91) (7,409) 27.281 (25.615) 1.434 (3,681) (6,043) 79 (6,545) 307 (421) 205 111 (58) 038) 15 91 (262) 241 (5) 2,945 6.373 9.31% 392 (2.477) 8.850 6.373 362 1.238 7.612 8.850 295 S 555 $ 3.925 $6,000 Refer to Notes to Consolidated Financial Statements APPENDIX C Specimen Financial Statements: The Coca-Cola Company CS The Coca-Cola Company and Subsidiaries Consolidated Statements of Shareowners' Equity 2015 2017 2016 4.259 48 (39) 4.288 53 4334 SO (85) 4.28 4.259 $ 1,760 $ 1,760 $ 1,760 15.864 467 14.993 655 14.016 589 130 258 225 (36) 219 (3) 16.520 15.864 14.993 65. S02 65,015 60,430 3.014 6414 (6.644) 63,234 1.248 (6.320) 6527 (6.043) 60,430 65.502 Year Ended December 31, (in millions except per share data) EQUITY ATTRIBUTABLE TO SHAREOWNERS OF THE COCA-COLA COMPANY NUMBER OF COMMON SHARES OUTSTANDING Balance at beginning of year Treasury stock issued to employees related to stock compensation plans Purchases of stock for treasury Balance at end of year COMMON STOCK CAPITAL SURPLUS Balance at beginning of year Stock Issued to employees related to stock compensation plans Tax benefit (charge) from stock compensation plans Stock-based compensation expense Other activities Balance at end of year REINVESTED EARNINGS Balance at beginning of year Adoption of accounting standards! Net Income attributable to shareowners of The Coca-Cola Company Dividends (per share-51.56, 51.48 and $1.40 in 2018, 2017 and 2016, respectively) Balance at end of year ACCUMULATED OTHER COMPREHENSIVE INCOME (LOSS) Balance at beginning of year Adoption of accounting standards! Net other comprehensive income (los) Balance at end of year TREASURY STOCK Balance at beginning of year Treasury stock issued to employees related to stock compensation plans Purchases of stock for treasury Balance at end of year TOTAL EQUITY ATTRIBUTABLE TO SHAREOWNERS OF THE COCA COLA COMPANY EQUITY ATTRIBUTABLE TO NONCONTROLLING INTERESTS Balance at beginning of year Netcome attributable to noncontrolling interests Net foreign currency translation adjustments Dividends paid to noncontrolling interests Contributions by noncontrolling interests Business combinations Deconsolidation of certain entities Other activities TOTAL EQUITY ATTRIBUTABLE TO NONCONTROLLING INTERESTS Refer to Note 1. Note 3, Note 4 and Note 15 Refer to Notes to consolidated Financial Statements (11.205) (10,174) (10,305) (409) (2.100) (12.814) 900 (10305) (1,031) (11.205) (50.677) 704 (1.746) (51,719) 516,981 (47.988) 909 (3.598) (50,677) $17,072 (45.066) 811 (3.733) (47.985) $23.062 $ 1,905 5 155 42 53 (33) 35 38 (15) $ 210 23 (13) (25) 1 101 1.805 (157) (34) 7 41 $ 2,077 5 1.05 $ 158
Step by Step Solution
There are 3 Steps involved in it

Get step-by-step solutions from verified subject matter experts