

Question: $ per unit a $70 Private MC $60 $50 $40 C social MB e private MB 20 36 55 # of units The graph above
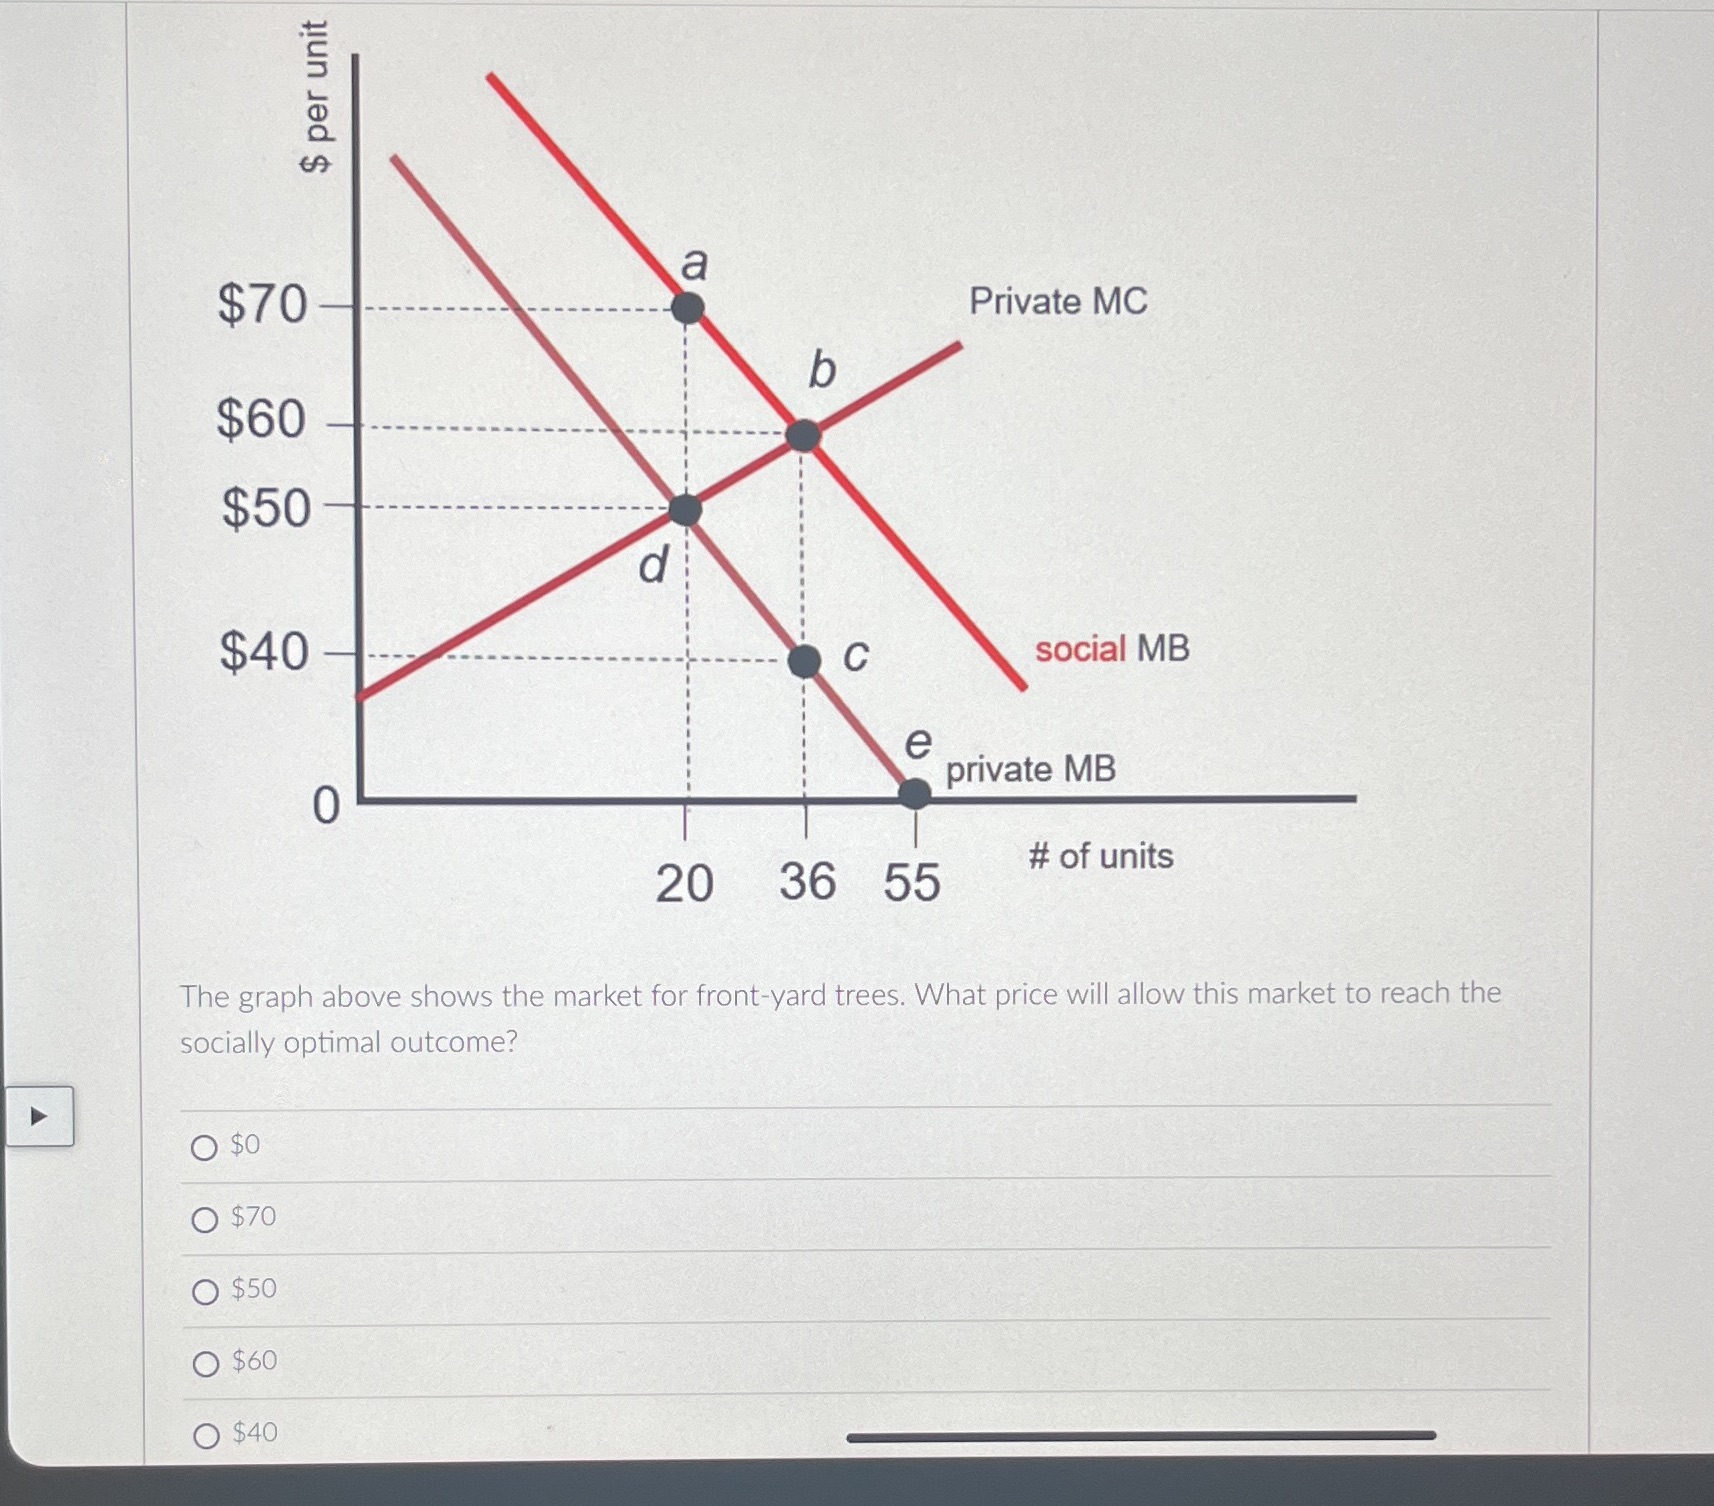

$ per unit a $70 Private MC $60 $50 $40 C social MB e private MB 20 36 55 # of units The graph above shows the market for front-yard trees. What price will allow this market to reach the socially optimal outcome? O $0 O $70 $50 O $60 O $40
Step by Step Solution
There are 3 Steps involved in it
1 Expert Approved Answer
Step: 1 Unlock

Question Has Been Solved by an Expert!
Get step-by-step solutions from verified subject matter experts
Step: 2 Unlock
Step: 3 Unlock