

Question: Percent % Dollars $000 Income Statement Data Source: Industry Reports - Annual Report for Round 3 Page 2 Note that report data is reflected in
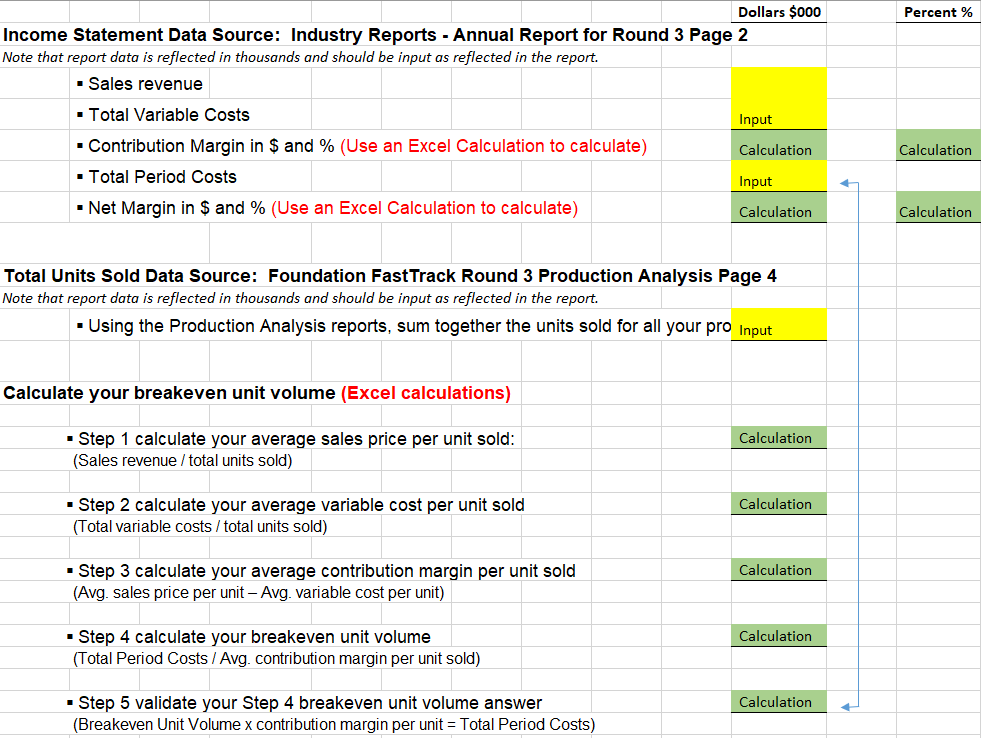
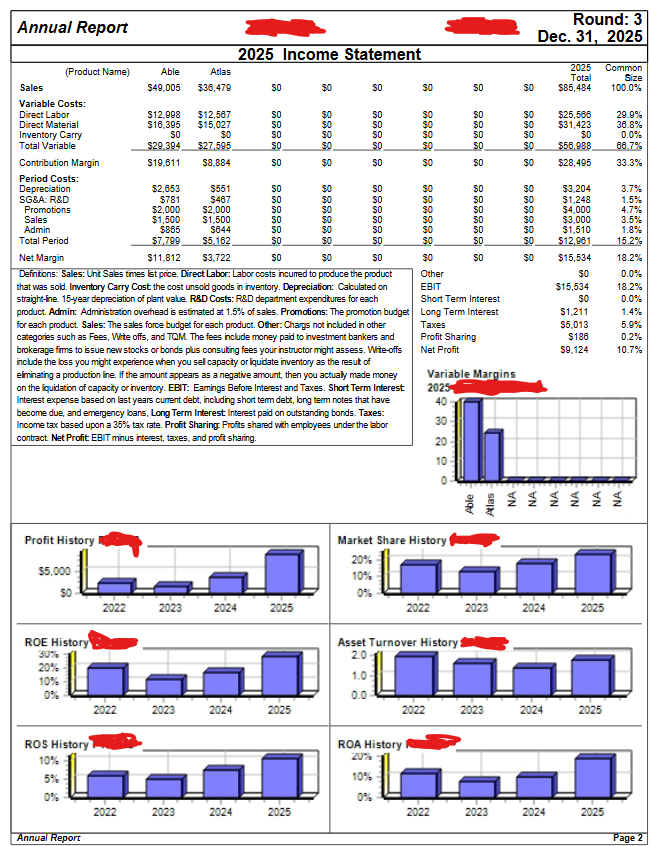
Percent % Dollars $000 Income Statement Data Source: Industry Reports - Annual Report for Round 3 Page 2 Note that report data is reflected in thousands and should be input as reflected in the report. Sales revenue Input Calculation Calculation Total Variable Costs Contribution Margin in $ and % (Use an Excel Calculation to calculate) Total Period Costs .Net Margin in $ and % (Use an Excel Calculation to calculate) Input Calculation Calculation Total Units Sold Data Source: Foundation Fast Track Round 3 Production Analysis Page 4 Note that report data is reflected in thousands and should be input as reflected in the report. . Using the Production Analysis reports, sum together the units sold for all your pro Input Calculate your breakeven unit volume (Excel calculations) Calculation . Step 1 calculate your average sales price per unit sold: (Sales revenue / total units sold) 1 Calculation Step 2 calculate your average variable cost per unit sold (Total variable costs / total units sold) Calculation . Step 3 calculate your average contribution margin per unit sold (Avg. sales price per unit - Avg. variable cost per unit) Calculation Step 4 calculate your breakeven unit volume (Total Period Costs / Avg. contribution margin per unit sold) Calculation Step 5 validate your Step 4 breakeven unit volume answer (Breakeven Unit Volume x contribution margin per unit = Total Period Costs) 50 $ 8 6888 Round: 3 Annual Report Dec. 31, 2025 2025 Income Statement (Product Name) Able Atlas 2025 Common Total Size Sales $49.005 $38,479 SO $ SO $0 $0 $0 $85,484 100.0% Variable Costs: Direct Labor $12.998 $12,567 SO $0 SO SO $ $25,586 29.9% Direct Material $16,395 $15,027 SO SO $ $0 $31,423 38.8% Inventory Carry SO $0 SO SO $ SO $ $0 0.0% Total Variable $29.304 $27,595 SO SO SO SO 556.988 66.7% Contribution Margin $19.811 $8.884 SO SO $0 SO $ $28,495 33.3% Period Costs: Depreciation $2,653 $551 SO SO $0 $0 $ $3,204 3.7% SG&A: R&D $781 $467 SO SO $0 SO $ $1,248 1.5% Promotions $2.000 $2.000 SO SO $0 SO $0 $4,000 4.7% Sales $1,500 $1.500 SO SO $0 SO $0 $3,000 3.5% Admin $865 9644 SO SO $0 SO $ $1,510 1.8% Total Period $7.799 $5.162 SO SO SO SO SO $12.981 15.2% Net Margin $11,812 $3.722 SO SO $0 SO $ $15,534 18.2% Definitions: Sales: Unt Sales times ist price. Direct Labor: Labor costs incurred to produce the product Other $0 0.0% that was sold. Inventory Carry Cost the cost unsold goods in inventory. Depreciation: Calculated on EBIT $15,534 18.2% straight-ine. 15-year depreciation of plant value. R&D Costs: R&D department expenditures for each Short Term Interest $0 0.0% product. Admin: Administration overhead is estimated at 1.5% of sales. Promotions: The promotion budget Long Term Interest $1.211 1.4% for each product. Sales: The sales force budget for each product. Other: Chargs not included in other Taxes $5.013 5.9% categories such as Fees, Wite offs, and TQM. The fees include money paid to investment bankers and Profit Sharing $188 0.2% brokerage firms to issue new stocks or bonds plus consulting fees your instructor might assess. Write-offs Net Profit $9.124 10.7% include the bss you might experience when you sel capacty or liquidate inventory as the resut of elminating a production Ine. If the amount appears as a negative amount, then you actualy made money Variable Margins on the iquidation of capacity or inventory. EBIT: Earnings Before Interest and Taxes. Short Term Interest 2025 Interest expense based on last years current debt, including short term debt, long term notes that have 40 become due, and emergency loans, Long Term Interest Interest paid on outstanding bonds. Taxes: Income tax based upon a 35% tax rate. Profit Sharing Profits shared with employees under the labor 30 contract. Net Profit EBIT minus interest, taxes, and profit sharing. 20 888888888888 o 8 8 8 10 Able Atlas Profit History 55.000 Market Share History 20% 10% 0% 2022 SO 2022 2023 2024 2025 2023 2024 2025 ROE History Asset Turnover History 2.0 O 0 O O 1.0 20% 10% 0% 0.0 2022 2023 2024 2025 2022 2023 2024 2025 ROA History 20% 10% ROS History 10% 5% 0% 2022 Annual Report 0% 2023 2024 2025 2022 2023 2024 2025 Page 2
Step by Step Solution
There are 3 Steps involved in it

Get step-by-step solutions from verified subject matter experts