

Question: percentage question The frequency histogram below describes how long n = 106 employees have worked at a company. 35 30 29 25 21 20 18
percentage question
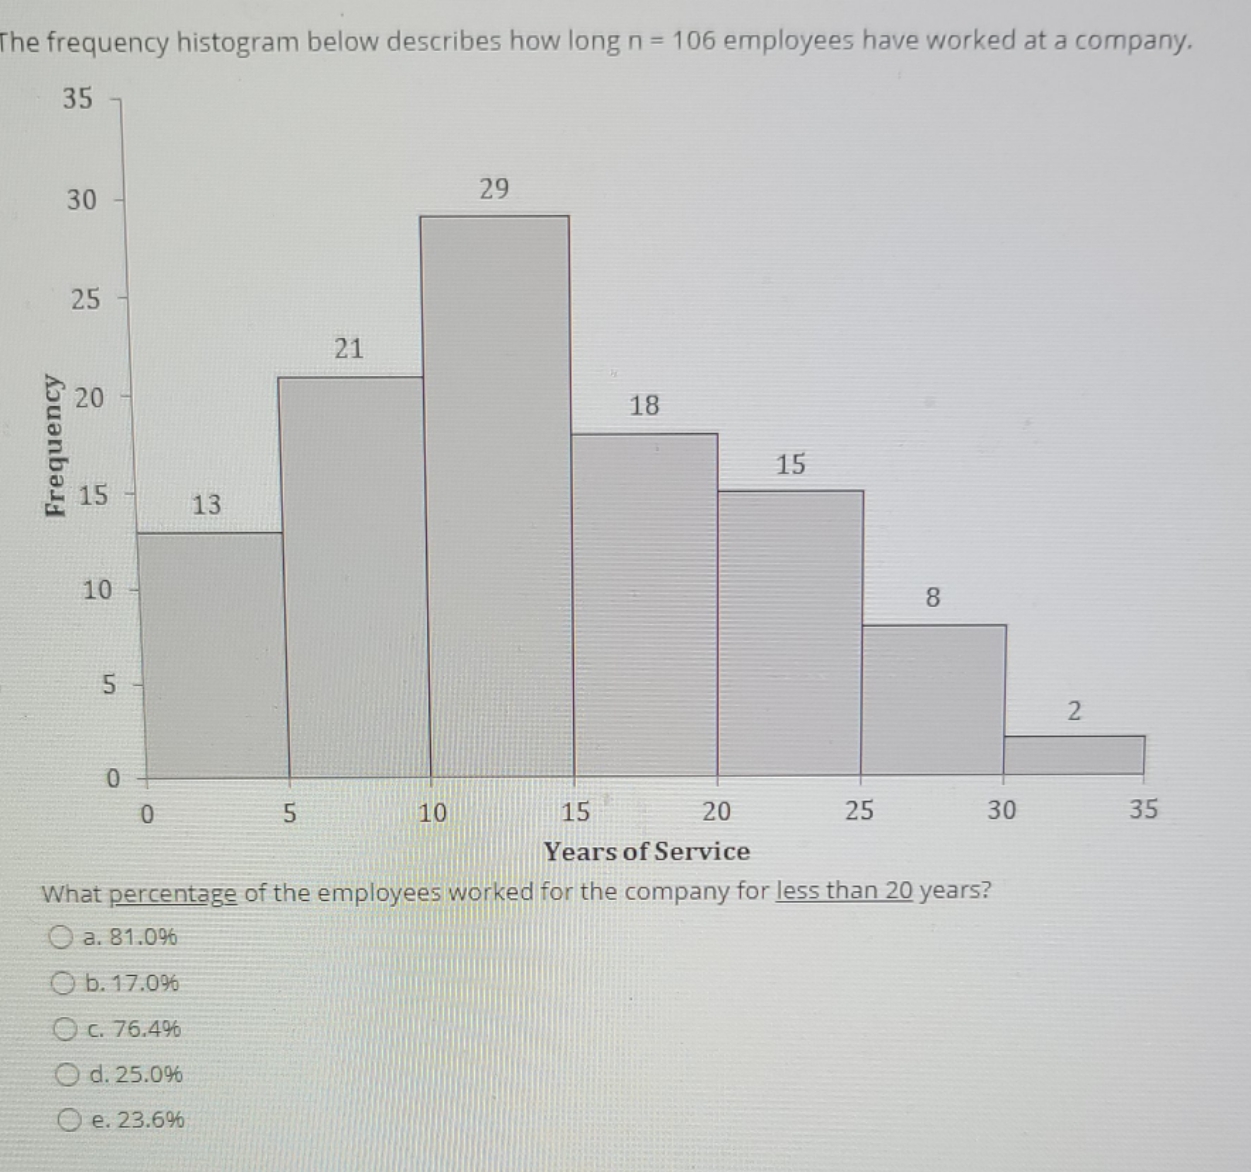
The frequency histogram below describes how long n = 106 employees have worked at a company. 35 30 29 25 21 20 18 Frequency 15 15 13 10 8 5 N 10 15 20 25 30 35 Years of Service What percentage of the employees worked for the company for less than 20 years? O a. 81.0% O b. 17.0% O c. 76.49% O d. 25.0% O e. 23.6%
Step by Step Solution
There are 3 Steps involved in it
1 Expert Approved Answer
Step: 1 Unlock

Question Has Been Solved by an Expert!
Get step-by-step solutions from verified subject matter experts
Step: 2 Unlock
Step: 3 Unlock