

Question: Percentiles box whisker plot 3.3 Percentiles Box-Whisker Plots: Problem 2 Previous Problem Problem List Next Problem (1 point) Consider the following box and whisker plot.
Percentiles box whisker plot
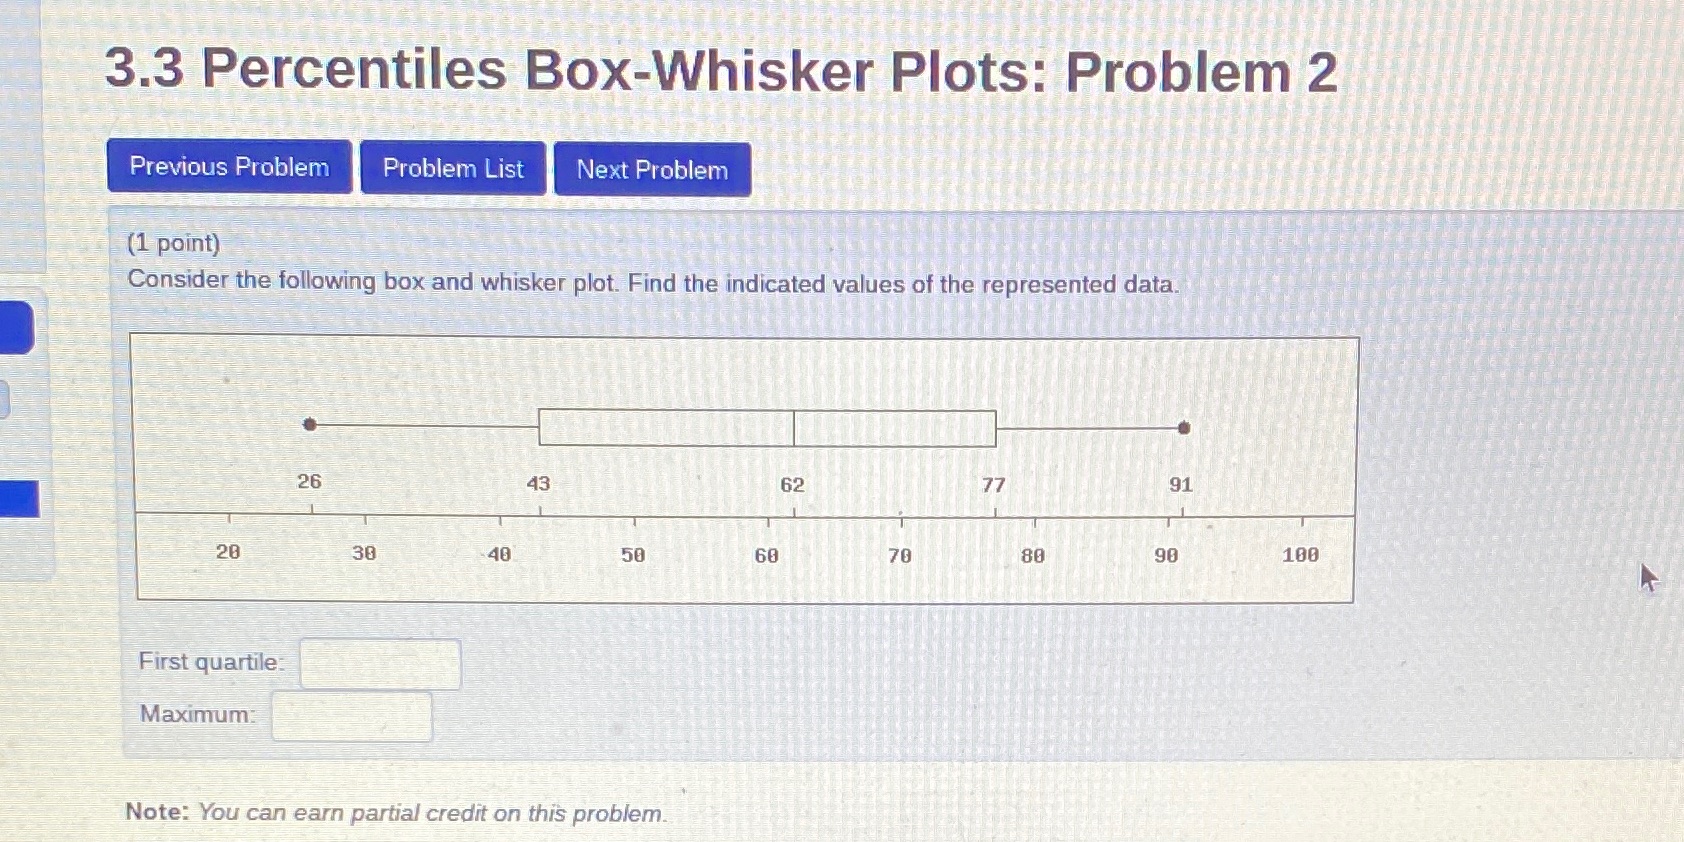
3.3 Percentiles Box-Whisker Plots: Problem 2 Previous Problem Problem List Next Problem (1 point) Consider the following box and whisker plot. Find the indicated values of the represented data. 26 43 62 77 91 20 30 40 50 60 70 80 90 106 First quartile: Maximum: Note: You can earn partial credit on this
Step by Step Solution
There are 3 Steps involved in it
1 Expert Approved Answer
Step: 1 Unlock

Question Has Been Solved by an Expert!
Get step-by-step solutions from verified subject matter experts
Step: 2 Unlock
Step: 3 Unlock