

Question: perform a descriptive analysis of the data, complete with descriptive statistics and graphs (as complete as you think appropriate). Apply whatever techniques you wish to
perform a descriptive analysis of the data, complete with descriptive statistics and graphs (as complete as you think appropriate). Apply whatever techniques you wish to look for an underlying pattern. After you have completed the descriptive analysis, perform an appropriate hypothesis test to evaluate the presence of some sort of nonrandom pattern
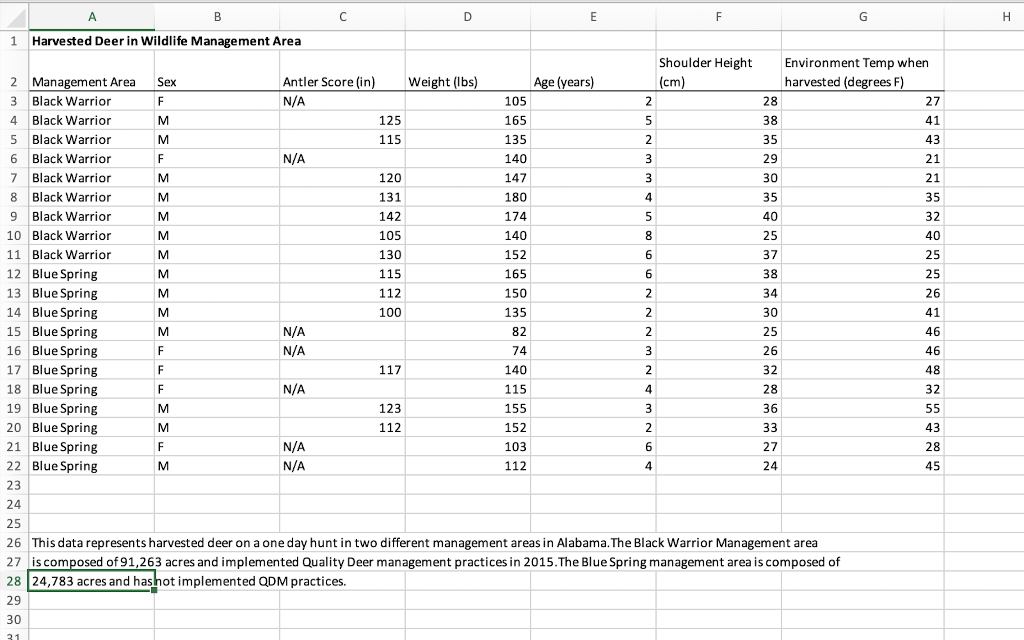
H A B D E F G 1 Harvested Deer in Wildlife Management Area Shoulder Height Environment Temp when 2 Management Area Sex Antler Score (in) Weight (lbs) Age (years) (cm) harvested (degrees F) 3 Black Warrior F N/A / 105 2 28 27 4 Black Warrior M 125 165 5 38 41 5 Black Warrior 5 M 115 135 2 35 43 6 Black Warrior F N/A 140 3 29 21 7 Black Warrior M 120 147 3 30 21 8 Black Warrior M 131 180 4 35 35 9 Black Warrior M 142 174 5 40 32 10 Black Warrior M 105 140 8 25 40 11 Black Warrior M 130 152 6 37 25 12 Blue Spring M 115 165 6 38 25 13 Blue Spring M 112 150 2 2 34 26 14 Blue Spring M M 100 135 2 30 41 15 Blue Spring M N/A 82 2 25 46 16 Blue Spring F N/A 74 3 26 46 17 Blue Spring F 117 140 2 32 48 18 Blue Spring F N/A 115 4 28 32 19 Blue Spring M 123 155 3 36 55 20 Blue Spring M 112 152 2 33 43 21 Blue Spring F N/A 103 6 27 28 22 Blue Spring M N/A 112 4 24 45 23 24 25 26 This data represents harvested deer on a one day hunt in two different management areas in Alabama. The Black Warrior Management area a 27 is composed of 91,263 acres and implemented Quality Deer management practices in 2015. The Blue Spring management area is composed of 28 24,783 acres and has not implemented QDM practices. 29 30 21Step by Step Solution
There are 3 Steps involved in it
1 Expert Approved Answer
Step: 1 Unlock

Question Has Been Solved by an Expert!
Get step-by-step solutions from verified subject matter experts
Step: 2 Unlock
Step: 3 Unlock