

Question: perform a horizontal analysis for 2018,2019,2020 B D E G H Horizontal Analysis 2018 2019 2020 Base Year 2018 232,887,000 173,183,000 59,704,000 47,283,000 12,421,000 977,000
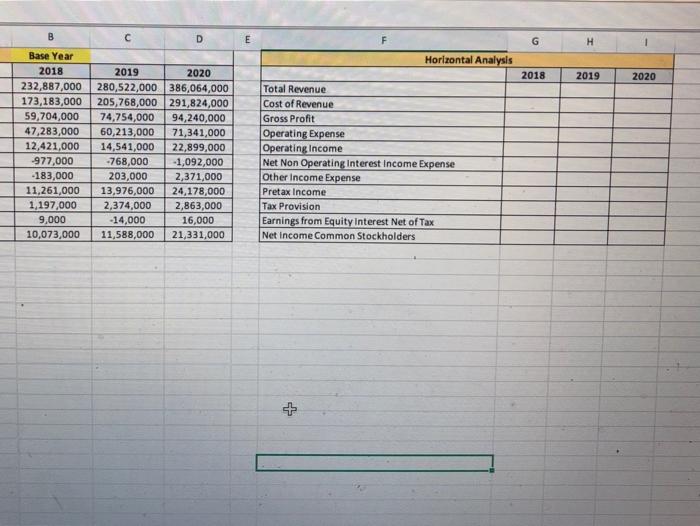
B D E G H Horizontal Analysis 2018 2019 2020 Base Year 2018 232,887,000 173,183,000 59,704,000 47,283,000 12,421,000 977,000 -183,000 11,261,000 1,197,000 9,000 10,073,000 2019 2020 280,522,000 386,064,000 205,768,000 291,824,000 74,754,000 94,240,000 60,213,000 71,341,000 14,541,000 22,899,000 -768,000 -1,092,000 203,000 2,371,000 13,976,000 24,178,000 2,374,000 2,863,000 -14,000 16,000 11,588,000 21,331,000 Total Revenue Cost of Revenue Gross Profit Operating Expense Operating Income Net Non Operating Interest Income Expense Other Income Expense Pretax income Tax Provision Earnings from Equity Interest Net of Tax Net Income Common Stockholders
Step by Step Solution
There are 3 Steps involved in it

Get step-by-step solutions from verified subject matter experts