

Question: Perform a horizontal analysis for the entry Gross Sales shown on the income statement portion below. (Round percentages to one decimal place.) Increase/Decrease Revenue 2019
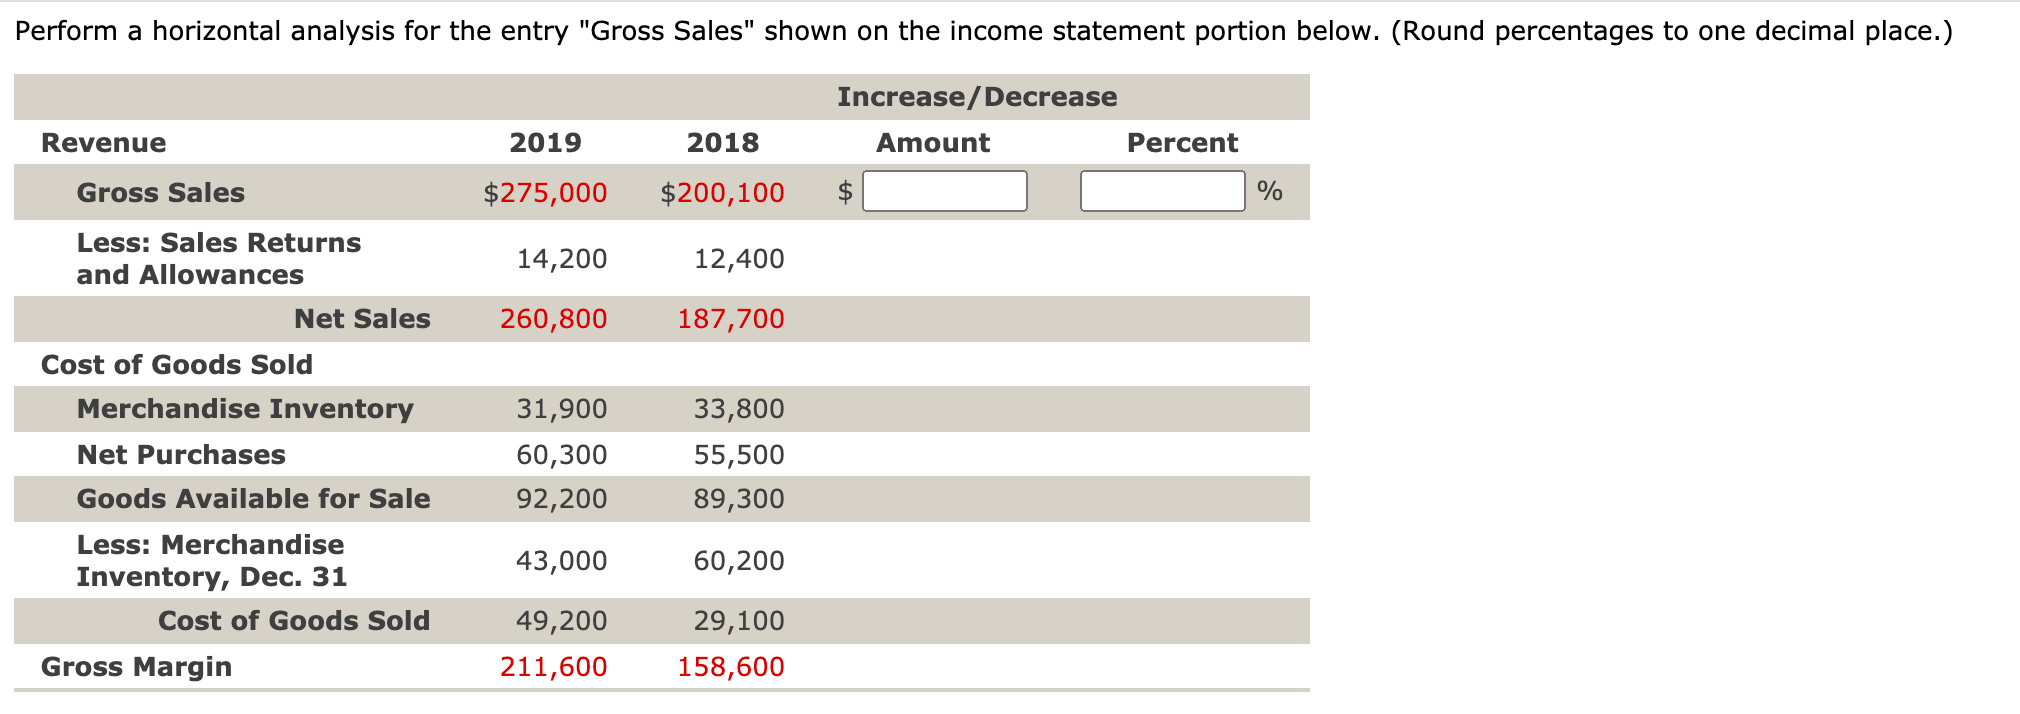
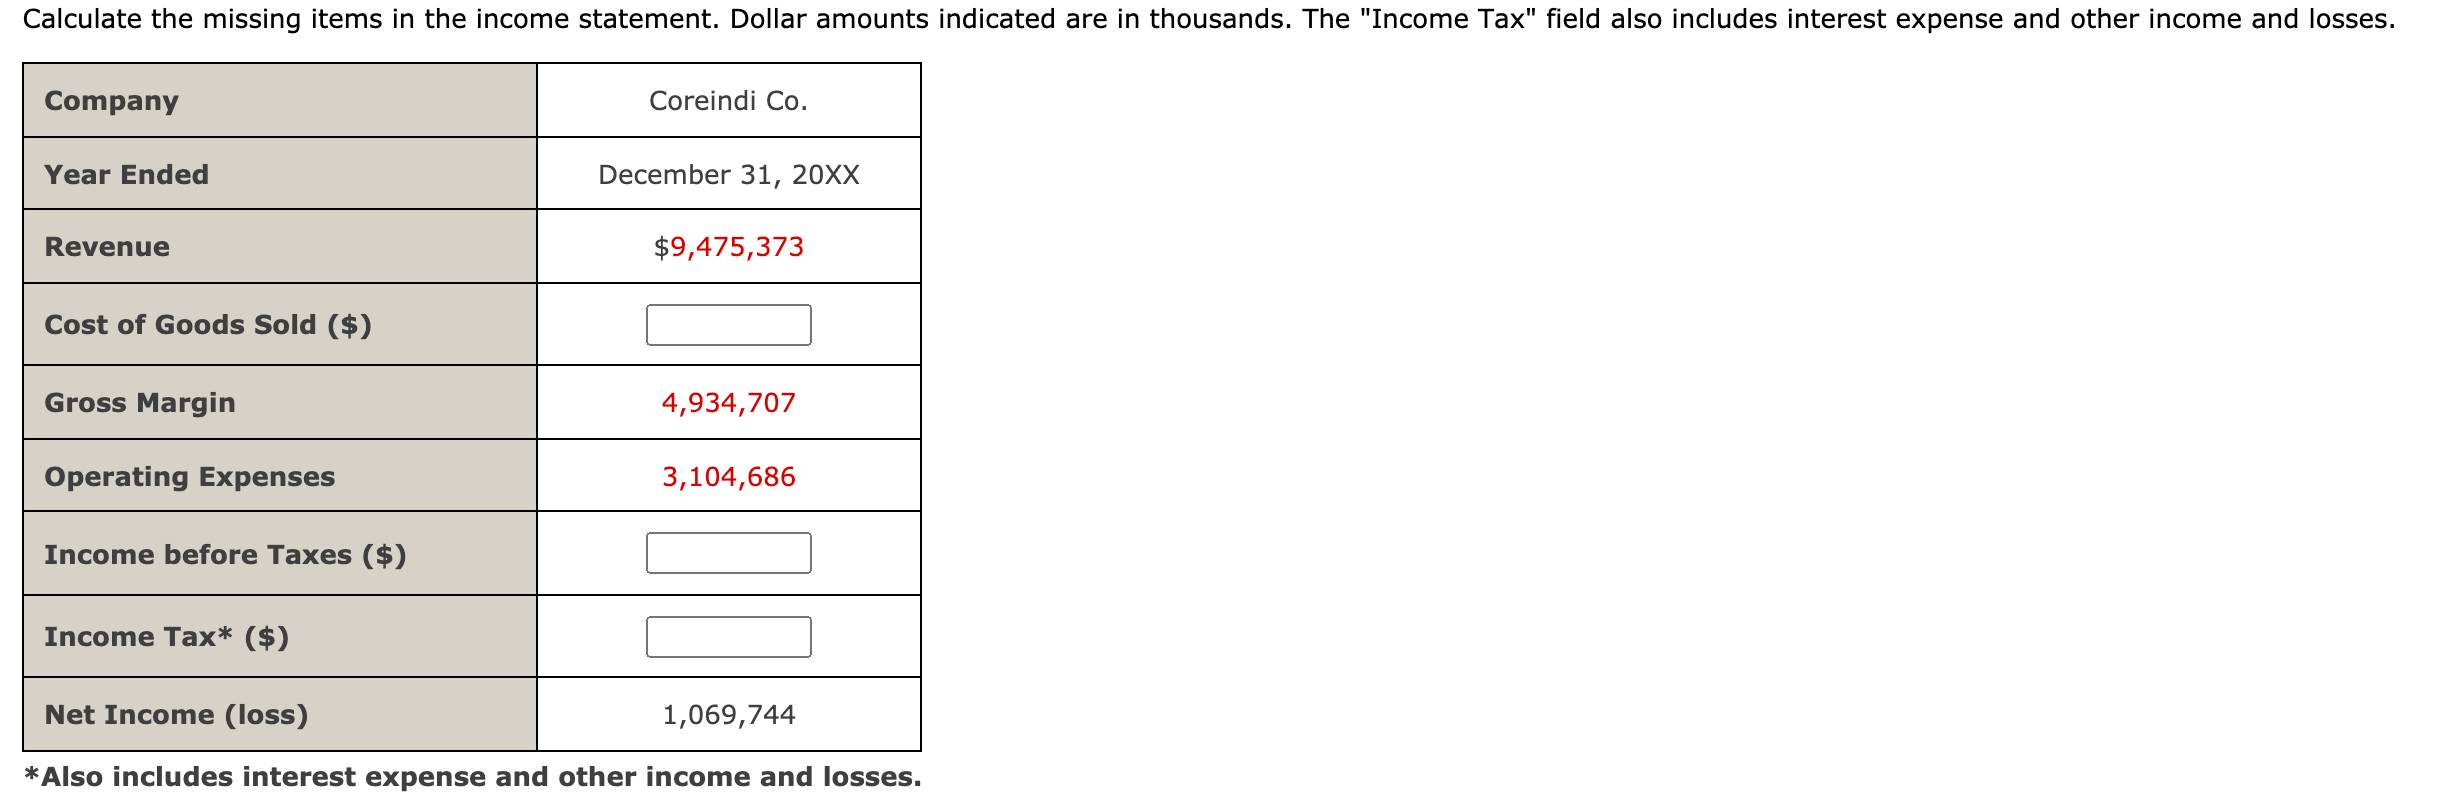
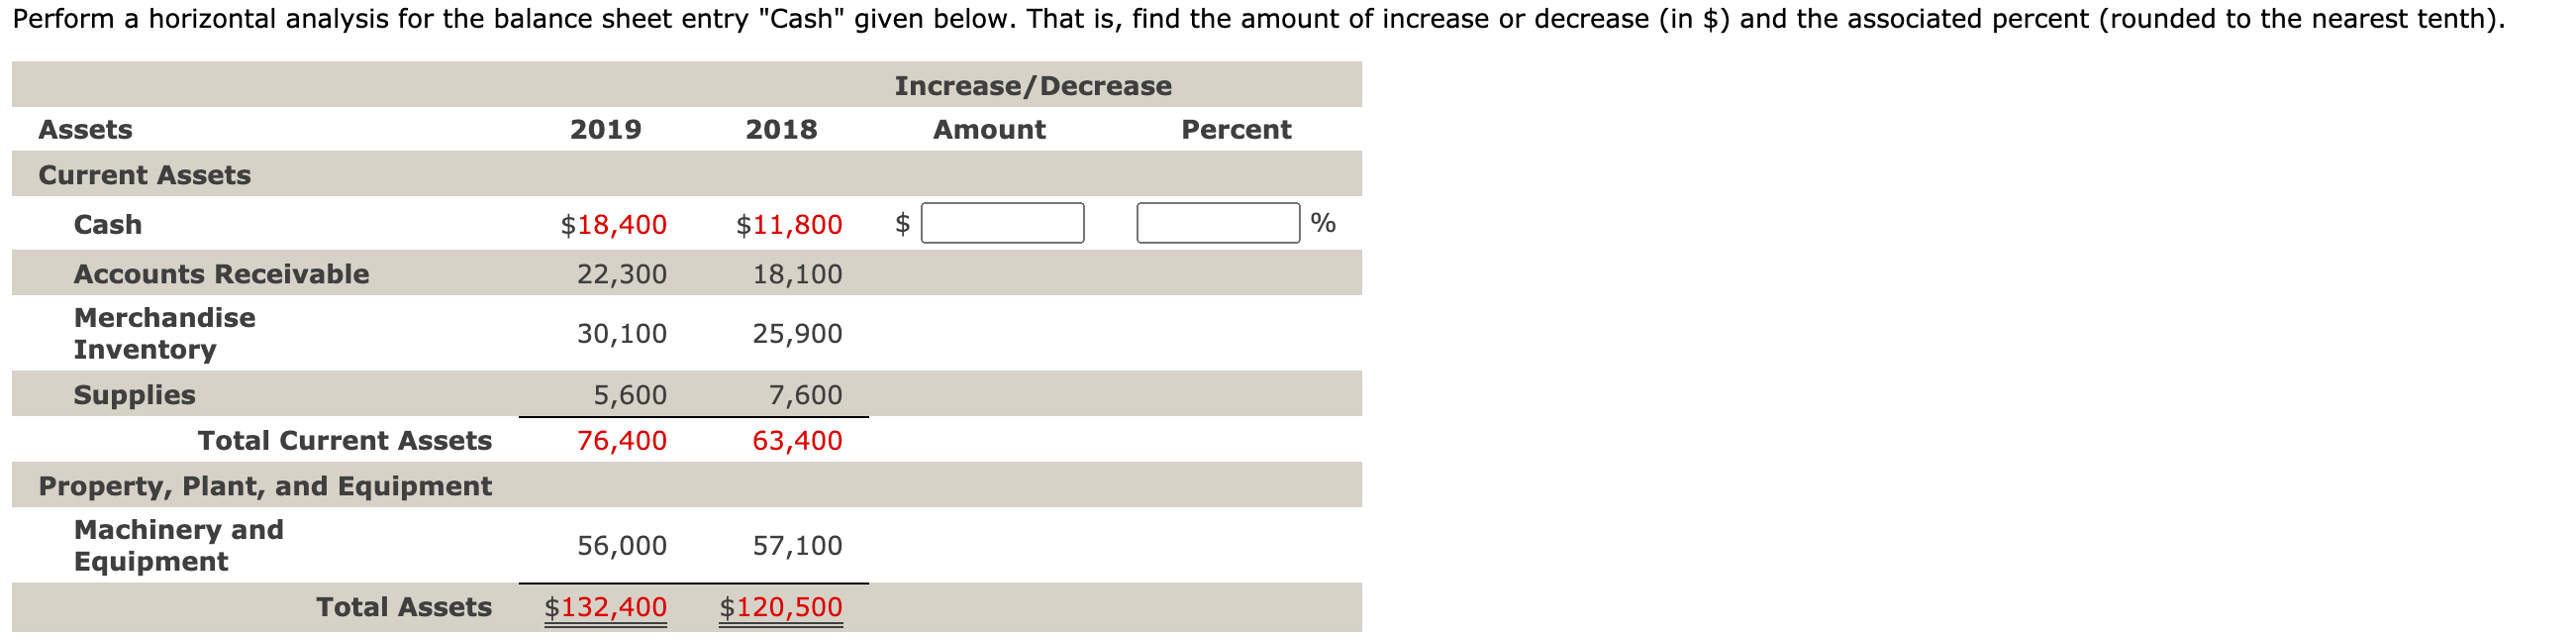
Perform a horizontal analysis for the entry "Gross Sales" shown on the income statement portion below. (Round percentages to one decimal place.) Increase/Decrease Revenue 2019 2018 Amount Percent Gross Sales $275,000 $200,100 % Less: Sales Returns and Allowances 14,200 12,400 Net Sales 260,800 187,700 Cost of Goods Sold Merchandise Inventory 31,900 33,800 Net Purchases 60,300 55,500 Goods Available for Sale 92,200 89,300 Less: Merchandise Inventory, Dec. 31 43,000 60,200 Cost of Goods Sold 49,200 29,100 Gross Margin 211,600 158,600 Calculate the missing items in the income statement. Dollar amounts indicated are in thousands. The "Income Tax" field also includes interest expense and other income and losses. Company Coreindi Co. Year Ended December 31, 20XX Revenue $9,475,373 Cost of Goods Sold ($) Gross Margin 4,934,707 Operating Expenses 3,104,686 Income before Taxes ($) Income Tax* ($) Net Income (loss) 1,069,744 *Also includes interest expense and other income and losses. Perform a horizontal analysis for the balance sheet entry "Cash" given below. That is, find the amount of increase or decrease (in $) and the associated percent (rounded to the nearest tenth). Increase/Decrease Assets 2019 2018 Amount Percent Current Assets Cash $18,400 $11,800 % Accounts Receivable 22,300 18,100 Merchandise Inventory 30,100 25,900 Supplies 5,600 7,600 Total Current Assets 76,400 63,400 Property, Plant, and Equipment Machinery and Equipment 56,000 57,100 Total Assets $132,400 $120,500
Step by Step Solution
There are 3 Steps involved in it

Get step-by-step solutions from verified subject matter experts