

Question: Perform a horizontal analysis for Under Armour for years 2020, 2019, 2018, and 2017. Year Ended December 31, 2020 2019 2018 2017 (In thousands, except
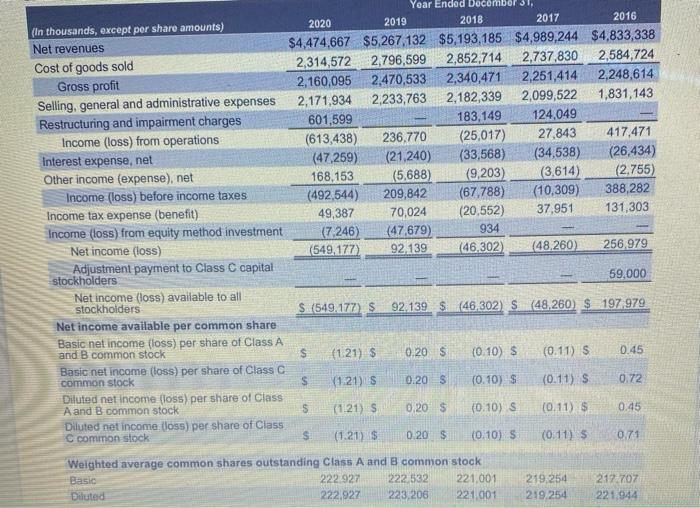
Year Ended December 31, 2020 2019 2018 2017 (In thousands, except per share amounts) 2016 Net revenues $4,474,667 $5,267,132 $5,193.185 $4,989,244 $4,833,338 Cost of goods sold 2,314,572 2,796,599 2,852,714 2,737,830 2,584,724 Gross profit 2,160,095 2,470,533 2,340,471 2,251,414 2,248,614 Selling, general and administrative expenses 2,171,934 2,233,763 2,182,339 2,099,522 1,831,143 Restructuring and impairment charges 601,599 183.149 124,049 Income (loss) from operations (613,438) 236,770 (25,017) 27,843 417,471 Interest expense, net (47,259) (21.240) (33,568) (34,538) (26,434) Other income (expense), net 168,153 (5.688) (9,203) (3.614) (2.755) Income (loss) before income taxes (492,544) 209,842 (67.788) (10,309) 388,282 Income tax expense (benefit) 49,387 70,024 (20,552) 37,951 131,303 Income (loss) from equity method investment (7.246) (47,679) 934 Net income (loss) (549.177 92,139 (46.302 (48.260) 256,979 Adjustment payment to Class C capital stockholders 59.000 Net income (loss) available to all stockholders $ (549.177) $ 92 139 $ (46,302) S (48,260) $ 197979 Net income available per common share Basic net income (loss) per share of Class A and B common stock S (1.21) $ 0.20 $ (0.10) $ (0.11) S Basic net income (loss) per share of Class o common stock S X121) 0.20 $ (0.10) $ (0.11) S 0.72 Diluted net income foss) per share of Class A and B common stock S (121) S 0,20 $ (0.10) S (0.11) $ 0.45 Diluted net income doss) per share of Class C common stock s (1.21) $ 0.20 (0.10) $ (0.11) $ 0.71 Weighted average common shares outstanding Class A and B common stock Basic 222 927 222,532 221.001 219,254 217.707 Diluted 222,927 223.208 221001 219.254 221.944 0.45
Step by Step Solution
There are 3 Steps involved in it

Get step-by-step solutions from verified subject matter experts