

Question: perform a multiple regression analysis inside of Microsoft Excel. Walk through the example regression problem. Learn by Marketing. (2018). Linear regression by hand and in
- perform a multiple regression analysis inside of Microsoft Excel.
- Walk through the example regression problem.
- Learn by Marketing. (2018).Linear regression by hand and in Excel(Links to an external site.)
- . Retrieved from http://www.learnbymarketing.com/tutorials/linear-regression-by-hand-in-excel/
Now perform a secondary regression using the changed data table you can download heredata-marketing-budget-12mo-version2[Excel file]
- Perform a multiple regression using the data "Use Sales" as the Y Range and "Social Media," "Web" and "Print" as the X-Range.
- Include residuals, line-fit plots and Normal probability plots.
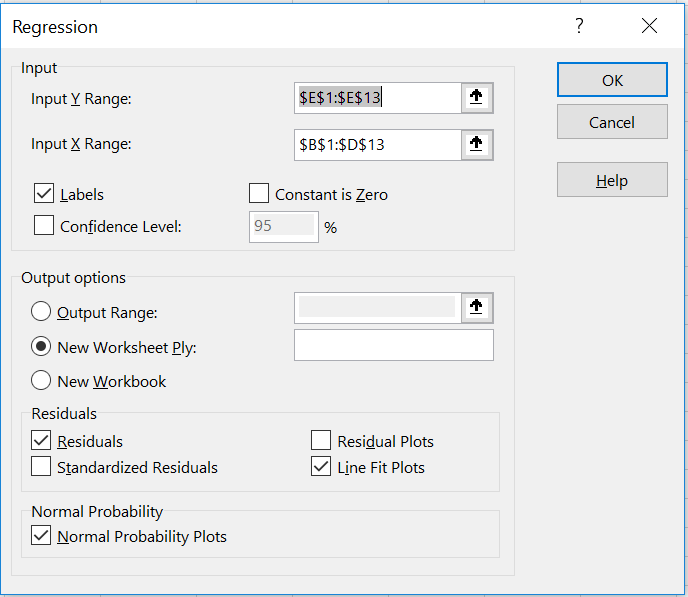
Regression X Input OK Input Y Range: $E$1:$E$13 Cancel Input X Range: $B$1:$D$13 T Help Labels Constant is Zero Confidence Level: 95 % Output options O Output Range: T O New Worksheet Ply: New Workbook Residuals V Residuals Residual Plots Standardized Residuals Line Fit Plots Normal Probability Normal Probability Plots
Step by Step Solution
There are 3 Steps involved in it
1 Expert Approved Answer
Step: 1 Unlock

Question Has Been Solved by an Expert!
Get step-by-step solutions from verified subject matter experts
Step: 2 Unlock
Step: 3 Unlock