

Question: Perform all computations in the script below. Only display the output requested below (suppress display of all other computations). Consider the data file, DFWtemps.dat
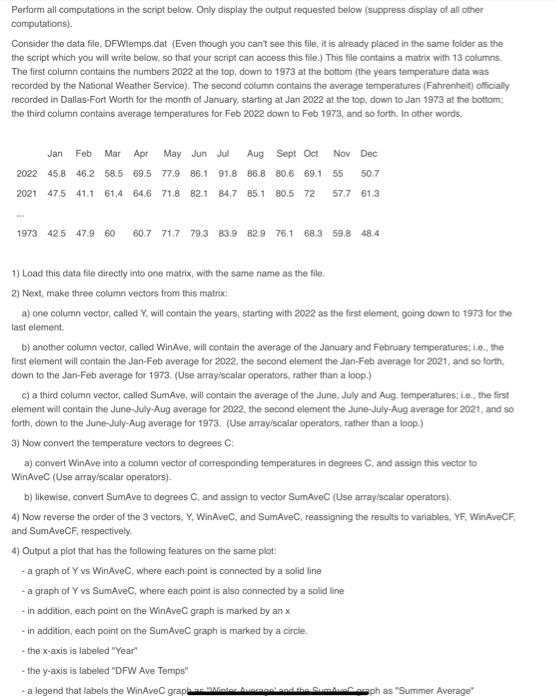
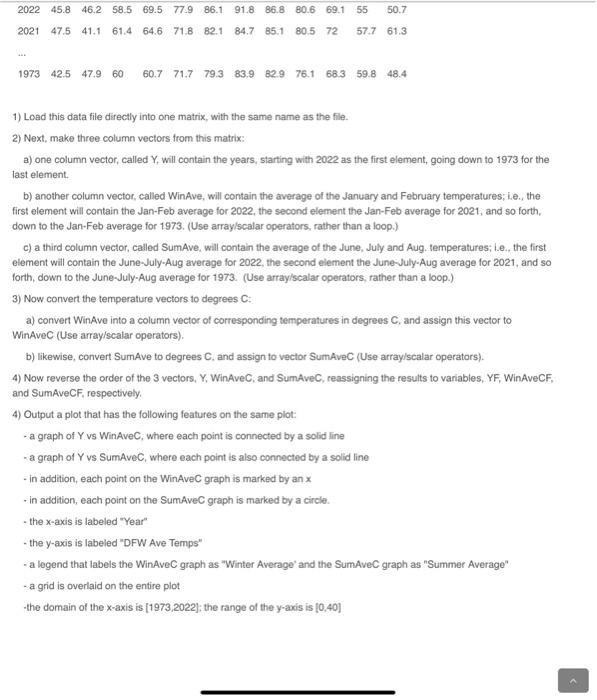
Perform all computations in the script below. Only display the output requested below (suppress display of all other computations). Consider the data file, DFWtemps.dat (Even though you can't see this file, it is already placed in the same folder as the the script which you will write below, so that your script can access this file.) This file contains a matrix with 13 columns. The first column contains the numbers 2022 at the top, down to 1973 at the bottom (the years temperature data was recorded by the National Weather Service). The second column contains the average temperatures (Fahrenheit) officially recorded in Dallas-Fort Worth for the month of January, starting at Jan 2022 at the top, down to Jan 1973 at the bottom: the third column contains average temperatures for Feb 2022 down to Feb 1973, and so forth. In other words, Jan Feb Mar Apr May Jun Jul Aug Sept Oct Nov Dec 2022 45.8 46.2 58.5 69.5 77.9 86.1 91.8 86.8 80.6 69.1 55 50.7 2021 47.5 41.1 61.4 64.6 71.8 82.1 84.7 85.1 80.5 72 57.7 61.3 1973 42.5 47.9 60 60.7 71.7 79.3 83.9 82.9 76.1 68.3 59.8 48.4 1) Load this data file directly into one matrix, with the same name as the file. 2) Next, make three column vectors from this matrix: a) one column vector, called Y, will contain the years, starting with 2022 as the first element, going down to 1973 for the last element. b) another column vector, called WinAve, will contain the average of the January and February temperatures; i.e., the first element will contain the Jan-Feb average for 2022, the second element the Jan-Feb average for 2021, and so forth, down to the Jan-Feb average for 1973. (Use array/scalar operators, rather than a loop.) c) a third column vector, called SumAve, will contain the average of the June, July and Aug. temperatures; ie, the first element will contain the June-July-Aug average for 2022, the second element the June-July-Aug average for 2021, and so forth, down to the June-July-Aug average for 1973. (Use array/scalar operators, rather than a loop.) 3) Now convert the temperature vectors to degrees C: a) convert WinAve into a column vector of corresponding temperatures in degrees C, and assign this vector to WinAvec (Use array/scalar operators). b) likewise, convert SumAve to degrees C, and assign to vector SumAvec (Use array/scalar operators). 4) Now reverse the order of the 3 vectors, Y, WinAveC, and SumAveC, reassigning the results to variables, YF, Win AveCF, and SumAveCF, respectively. 4) Output a plot that has the following features on the same plot: - a graph of Y vs WinAveC, where each point is connected by a solid line - a graph of Y vs SumAveC, where each point is also connected by a solid line - in addition, each point on the WinAvec graph is marked by an x - in addition, each point on the SumAvec graph is marked by a circle. - the x-axis is labeled "Year" - the y-axis is labeled "DFW Ave Temps" - a legend that labels the WinAvec grapha Moter Auerngel Ausal ph as "Summer Average" 2022 45.8 46.2 58.5 69.5 77.9 86.1 91.8 86.8 80.6 69.1 55 50.7 2021 47.5 41.1 61.4 64.6 71.8 82.1 84.7 85.1 80.5 72 57.7 61.3 1973 42.5 47.9 60 60.7 71.7 79.3 83.9 82.9 76.1 68.3 59.8 48.4 1) Load this data file directly into one matrix, with the same name as the file. 2) Next, make three column vectors from this matrix: a) one column vector, called Y, will contain the years, starting with 2022 as the first element, going down to 1973 for the last element. b) another column vector, called WinAve, will contain the average of the January and February temperatures; i.e., the first element will contain the Jan-Feb average for 2022, the second element the Jan-Feb average for 2021, and so forth, down to the Jan-Feb average for 1973. (Use array/scalar operators, rather than a loop.) c) a third column vector, called SumAve, will contain the average of the June, July and Aug. temperatures; i.e., the first element will contain the June-July-Aug average for 2022, the second element the June-July-Aug average for 2021, and so forth, down to the June-July-Aug average for 1973. (Use array/scalar operators, rather than a loop.) 3) Now convert the temperature vectors to degrees C: a) convert WinAve into a column vector of corresponding temperatures in degrees C, and assign this vector to WinAvec (Use array/scalar operators). b) likewise, convert SumAve to degrees C. and assign to vector SumAvec (Use array/scalar operators). 4) Now reverse the order of the 3 vectors, Y, WinAveC, and SumAveC, reassigning the results to variables, YF, WinAveCF, and SumAveCF, respectively. 4) Output a plot that has the following features on the same plot: - a graph of Y vs WinAveC, where each point is connected by a solid line - a graph of Y vs SumAveC, where each point is also connected by a solid line - in addition, each point on the WinAvec graph is marked by an x - in addition, each point on the SumAvec graph is marked by a circle. - the x-axis is labeled "Year" - the y-axis is labeled "DFW Ave Temps" a le a legend that labels the WinAvec graph as "Winter Average and the SumAvec graph as "Summer Average" - a grid is overlaid on the entire plot -the domain of the x-axis is [1973,2022]; the range of the y-axis is [0,40]
Step by Step Solution
3.42 Rating (152 Votes )
There are 3 Steps involved in it
Below is a Python script that performs the computations described import numpy as np import ... View full answer

Get step-by-step solutions from verified subject matter experts