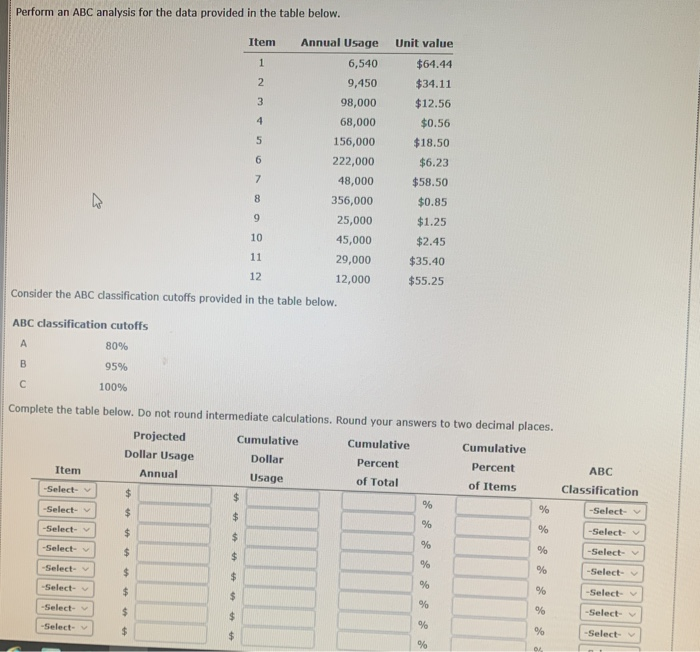
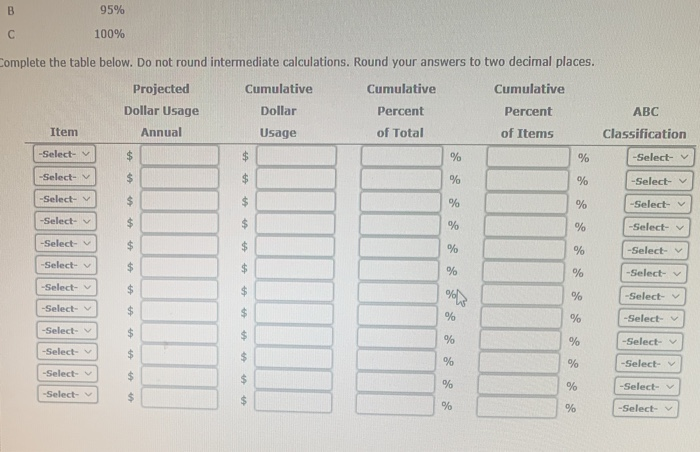
Question: Perform an ABC analysis for the data provided in the table below. Item Unit value $64.44 $34.11 $12.56 $0.56 $18.50 Annual Usage 6,540 9,450 98,000

Perform an ABC analysis for the data provided in
Perform an ABC analysis for the data provided in the table below. Item Unit value $64.44 $34.11 $12.56 $0.56 $18.50 Annual Usage 6,540 9,450 98,000 68,000 156,000 222,000 48,000 356,000 25,000 45,000 29,000 12,000 $6.23 $58.50 $0.85 $1.25 $2.45 $35.40 $55.25 Consider the ABC dassification cutoffs provided in the table below. ABC classification cutoffs 80% 95% 100% Complete the table below. Do not round intermediate calculations. Round your answers to two decimal places. Cumulative Projected Dollar Usage Annual Dollar Cumulative Percent of Total Cumulative Percent Item Usage -Select- of Items ABC Classification -Select- -Select- -Select- -Select- -Select- -Select- -Select- -Select- -Select- -Select- -Select- -Select -Select- -Select- B 95% 100% Complete the table below. Do not round intermediate calculations. Round your answers to two decimal places. Projected Dollar Usage Annual Cumulative Dollar Cumulative Percent of Total Cumulative Percent of Items ABC Classification Item Usage -Select- -Select- -Select- -Select- -Select- -Select- -Select- -Select- -Select- -Select- -Select- -Select- -Select- -Select- -Select- -Select- -Select- -Select -Select- -Select- -Select- -Select- -Select- -Select

Step by Step Solution

There are 3 Steps involved in it

1 Expert Approved Answer
Step: 1 Unlock blur-text-image
Question Has Been Solved by an Expert!

Get step-by-step solutions from verified subject matter experts

Step: 2 Unlock
Step: 3 Unlock

Students Have Also Explored These Related General Management Questions!