

Question: Perform descriptive analysis, statistical analysis for below data. Then draw histogram. And perform hypothesis testing by defining null hypothesis define h1 Mu1 Mu2 and Mu
Perform descriptive analysis, statistical analysis for below data.
Then draw histogram.
And perform hypothesis testing by
defining null hypothesis
define h1
Mu1
Mu2 and Mu d.
Below is the data of a car manufacturing company.
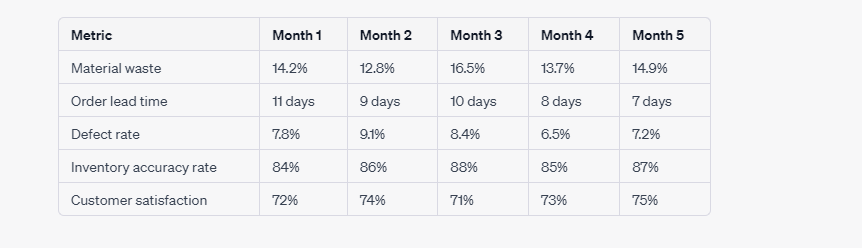
\begin{tabular}{|l|l|l|l|l|l|} \hline Metric & Month 1 & Month 2 & Month 3 & Month 4 & Month 5 \\ \hline Material waste & 14.2% & 12.8% & 16.5% & 13.7% & 14.9% \\ \hline Order lead time & 11 days & 9 days & 10 days & 8 days & 7 days \\ \hline Defect rate & 7.8% & 9.1% & 8.4% & 6.5% & 7.2% \\ \hline Inventory accuracy rate & 84% & 86% & 88% & 85% & 87% \\ \hline Customer satisfaction & 72% & 74% & 71% & 73% & 75% \\ \hline \end{tabular}
Step by Step Solution
There are 3 Steps involved in it

Get step-by-step solutions from verified subject matter experts