

Question: Perform horizontal and vertical analysis for THY using 2019-2018 financial statements. Based on the horizontal and vertical analysis, answer the following questions: What are the
- Perform horizontal and vertical analysis for THY using 2019-2018 financial statements. Based on the horizontal and vertical analysis, answer the following questions:
- What are the major investments of THY? Are there significant changes in these assets from 2018-2019?
- What are the major sources of assets for THY? Are there significant changes in these sources from 2018 to 2019?
- Is the net income of THY increasing or decreasing? What are the causes of the change that you observe?
- Is the sales revenue increasing or decreasing? How much? How do you evaluate the change of sales revenues of THY as compared to its industry?
- What are the major expenses? Are there significant changes in these expenses from 2018 to 2019?
- Perform ratio analysis on the financial statements of THY using the financial statements of the year 2019 and 2018. Based on your results, answer the following questions?
(In calculating your ratios assume that all sales are credit sales (on account) and the balance of assets and liabilities and equity at the end of the year represents the level all throughout the year)
- How do you evaluate the liquidity position of THY, based on changes over the previous year?
- How do you evaluate the profitability of THY, based on changes over the previous year?
- How do you evaluate the solvency of THY, based on changes over the previous year?
- Overall, what are your evaluations about the financial performance of THY based on 2019-2018 financial statement analysis.
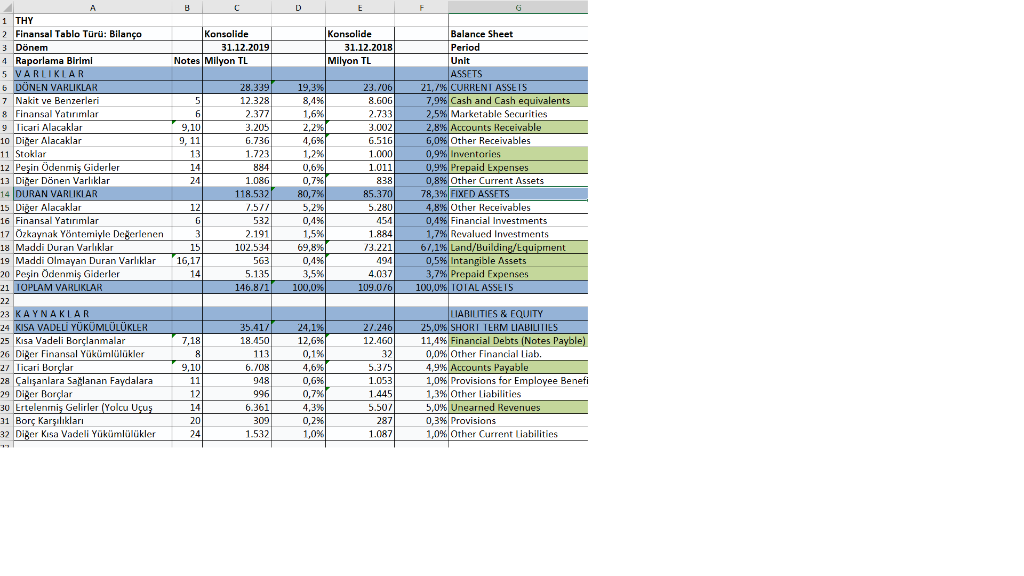
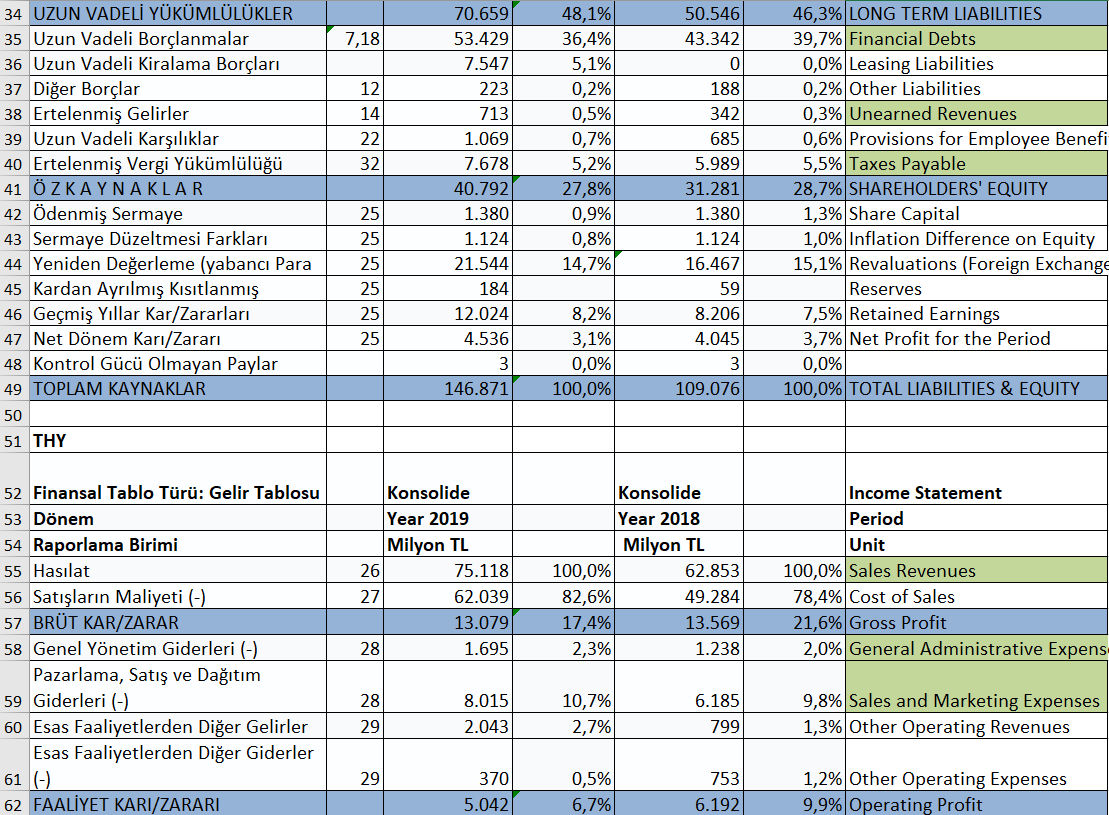
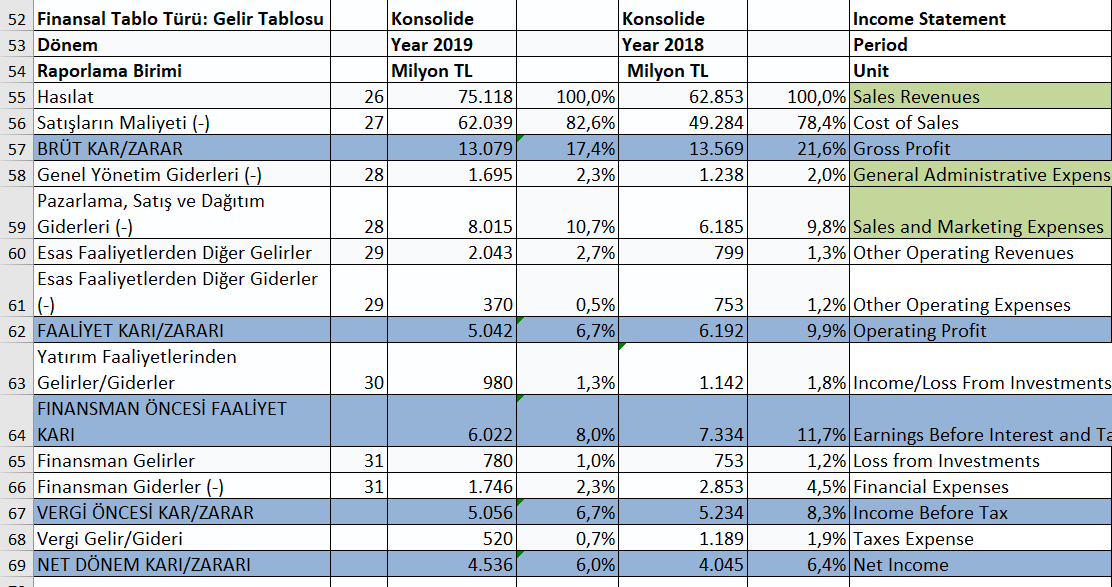
B C D E Konsolide 31.12.2019 Notes Milyon TL Konsolide 31.12.2018 Milyon TL 5 6 9,10 9, 11 13 14 24 1 THY 2 Finansal Tablo Tr: Bilano : 3 Dnem 4 Raporlama Birimi 5 VARLIKLAR 5 DNEN VARLIKLAR 7 Nakit ve Benzerleri 8 Finansal Yatrmlar 9 Ticari Alacaklar 10 Diger Alacaklar 11 Stoklar 12 Pein denmi Giderler 13 Diger Dnen Varlklar 14 DURAN VARLIKLAR 15 Diger Alacaklar 16 Finansal Yatrmlar 17 zkaynak Yntemiyle Deerlenen 18 Maddi Duran Varlklar 19 Maddi olmayan Duran Varlklar 20 Pein denmi Giderler 21 TOPLAM VARLIKLAR 22 23 KAYNAKLAR 24 KISA VADEL YKMLLKLER 25 Ksa Vadeli Borlanmalar 26 Diger Finansal ykmllkler 27 Ticari Borlar 28 alanlara Salanan Faydalara 29 Diger Borlar 30 Ertelenmi Gelirler (Yolcu Uus 31 Bor Karlklar 32 Diger Ksa Vadeli Ykmllkler 28.339 12.328 2.377 3.205 6.736 1.723 884 1.08G 118.532 7.5/1 532 2.191 102.534 563 5.135 146.871 19,3% 8,496 1,6% 2,2% 4,69 1,2% 0.6% % 0,7% 80,7% 5,2% 0,4% 1,5% 69,8% 0,4% 3,5% 100,0% 23.706 8.GOG 2.733 3.002 6.516 1.000 1.011 838 85.370 5.280 454 1.884 73.221 494 4.037 109.076 Balance Sheet Period Unit ASSETS 21,7% CURRENT ASSETS 7,9% Cash and Cash equivalents 2,5% Marketable Securities 2,8% Accounts Receivable 6,0% Other Receivables 0,9% Inventories 0,9% Prepaid Expenses 0,8% Other Current Assets 78,3% FIXED ASSETS 4,8% Other Receivables 0,4% Financial Investments 1,7% Revalued Investments 67,1% Land/Building/Equipment 0,5% Intangible Assets 3,7% Prepaid Expenses 100,0% TOTAL ASSETS 12 6 3 15 16,17 14 7,18 8 9,10 11 12 14 20 24 35.417 18.450 113 6./08 948 996 6.361 309 1.532 24.1% 12,6% 0,1% 4.6% 0,6% 0,7% 4,3% 0,29 1,0% 27.246 12.460 32 5.3/5 1.053 1.445 5.507 287 1.087 LIABILITIES & EQUITY 25,0% SHORT TERM LIABILITIES 11,4% Financial Debts (Notes Payble) 0,0% Other Financial liab. 4,9% Accounts Payable 1,0% Provisions for Employee Benefi 1,3% Other Liabilities 5,0% Unearned Revenues 0,3% Provisions 1,0%Other Current Liabilities 50.546) 43.342 7,18 70.659 53.429 7.547 223 0 713 12 14 22 32 34 UZUN VADEL YKMLLKLER 35 Uzun Vadeli Borlanmalar 36 Uzun Vadeli Kiralama Borlar 37 Dier Borlar 38 Ertelenmi Gelirler 39 Uzun Vadeli Karlklar 40 Ertelenmi Vergi Ykmll 41 ZKAYNAKLAR 42 denmi Sermaye 43 Sermaye Dzeltmesi Farklar 44 Yeniden Deerleme (yabanc Para 45 Kardan Ayrlm Kstlanm 46 Gemi Yllar Kar/Zararlar 47 Net Dnem Kari/Zarar 48 Kontrol Gc Olmayan Paylar 49 TOPLAM KAYNAKLAR 48,1% 36,4% 5,1% 0,2% 0,5% 0,7% 5,2% 27,8% 0,9% 0,8% 14,7% 1.069 7.678 40.792 1.380 1.124 21.544 184 12.024 4.536 3 146.871 25 25 25 25 25 25 46,3% LONG TERM LIABILITIES 39,7% Financial Debts 0,0% Leasing Liabilities 0,2% Other Liabilities 0,3% Unearned Revenues 0,6% Provisions for Employee Benefi 5,5% Taxes Payable 28,7% SHAREHOLDERS' EQUITY 1,3% Share Capital 1,0% Inflation Difference on Equity 15,1% Revaluations (Foreign Exchange Reserves 7,5% Retained Earnings 3,7% Net Profit for the Period 0,0% 100,0% TOTAL LIABILITIES & EQUITY 188 342 685 5.989 31.281 1.380 1.124 16.467 59 8.206 4.045 3 109.076 8,2% 3,1% 0,0% 100,0% 50 51 THY 52 Finansal Tablo Tr: Gelir Tablosu 53 Dnem 54 Raporlama Birimi 55 Hasilat 56 Satlarn Maliyeti (-) 57 BRT KAR/ZARAR 58 Genel Ynetim Giderleri (-) Pazarlama, Sat ve Datm 59 Giderleri (-) 60 Esas Faaliyetlerden Dier Gelirler Esas Faaliyetlerden Dier Giderler 61 (-) 62 FAALYET KARI/ZARARI Konsolide Year 2019 Milyon TL 26 75.118 27 62.039) 13.079 28 1.695 Konsolide Year 2018 Milyon TL 100,0% 62.853 82,6% 49.284 17,4% 13.569 2,3% 1.238 Income Statement Period Unit 100,0% Sales Revenues 78,4% Cost of Sales 21,6% Gross Profit 2,0% General Administrative Expens- 28 29 8.015 2.043 10,7% 2,7% 6.185 799 9,8% Sales and Marketing Expenses 1,3% Other Operating Revenues 29 370 5.0421 0,5% 6,7% 753 6.192 1,2% Other Operating Expenses 9,9% Operating Profit Konsolide Year 2019 Milyon TL 26 75.118 27 62.039 13.079 28 1.695 100,0% 82,6% 17,4% 2,3% Konsolide Year 2018 Milyon TL 62.853 49.284 13.569 1.238 Income Statement Period Unit 100,0% Sales Revenues 78,4% Cost of Sales 21,6% Gross Profit 2,0% General Administrative Expens 8.015 28 29 10,7% 2,7% 6.185 799 9,8% Sales and Marketing Expenses 1,3% Other Operating Revenues 2.043 52 Finansal Tablo Tr: Gelir Tablosu 53 Dnem 54 Raporlama Birimi 55 Hasilat 56 Satlarn Maliyeti (-) 57 BRT KAR/ZARAR 58 Genel Ynetim Giderleri (-) Pazarlama, Sat ve Datm 59 Giderleri (-) 60 Esas Faaliyetlerden Dier Gelirler Esas Faaliyetlerden Dier Giderler 61 (-) 62 FAALYET KARI/ZARARI Yatrm Faaliyetlerinden 63 Gelirler/Giderler FINANSMAN NCES FAALYET 64 KARI 65 Finansman Gelirler 66 Finansman Giderler (-) 67 VERG NCES KAR/ZARAR 68 Vergi Gelir/Gideri 69 NET DNEM KARI/ZARARI 29 370 5.042 0,5% 6,7% 753 6.192 1,2% Other Operating Expenses 9,9% Operating Profit 30 980 1,3% 1.142 1,8% Income/Loss From Investments 6.022 780 31 31 1.746 5.056 520 4.536 8,0% 1,0% 2,3% 6,7% 0,7% 6,0% 7.334 753 2.853 5.234 1.189 4.045 11,7% Earnings Before Interest and Ta 1,2% Loss from Investments 4,5% Financial Expenses 8,3% Income Before Tax 1,9% Taxes Expense 6,4% Net Income B C D E Konsolide 31.12.2019 Notes Milyon TL Konsolide 31.12.2018 Milyon TL 5 6 9,10 9, 11 13 14 24 1 THY 2 Finansal Tablo Tr: Bilano : 3 Dnem 4 Raporlama Birimi 5 VARLIKLAR 5 DNEN VARLIKLAR 7 Nakit ve Benzerleri 8 Finansal Yatrmlar 9 Ticari Alacaklar 10 Diger Alacaklar 11 Stoklar 12 Pein denmi Giderler 13 Diger Dnen Varlklar 14 DURAN VARLIKLAR 15 Diger Alacaklar 16 Finansal Yatrmlar 17 zkaynak Yntemiyle Deerlenen 18 Maddi Duran Varlklar 19 Maddi olmayan Duran Varlklar 20 Pein denmi Giderler 21 TOPLAM VARLIKLAR 22 23 KAYNAKLAR 24 KISA VADEL YKMLLKLER 25 Ksa Vadeli Borlanmalar 26 Diger Finansal ykmllkler 27 Ticari Borlar 28 alanlara Salanan Faydalara 29 Diger Borlar 30 Ertelenmi Gelirler (Yolcu Uus 31 Bor Karlklar 32 Diger Ksa Vadeli Ykmllkler 28.339 12.328 2.377 3.205 6.736 1.723 884 1.08G 118.532 7.5/1 532 2.191 102.534 563 5.135 146.871 19,3% 8,496 1,6% 2,2% 4,69 1,2% 0.6% % 0,7% 80,7% 5,2% 0,4% 1,5% 69,8% 0,4% 3,5% 100,0% 23.706 8.GOG 2.733 3.002 6.516 1.000 1.011 838 85.370 5.280 454 1.884 73.221 494 4.037 109.076 Balance Sheet Period Unit ASSETS 21,7% CURRENT ASSETS 7,9% Cash and Cash equivalents 2,5% Marketable Securities 2,8% Accounts Receivable 6,0% Other Receivables 0,9% Inventories 0,9% Prepaid Expenses 0,8% Other Current Assets 78,3% FIXED ASSETS 4,8% Other Receivables 0,4% Financial Investments 1,7% Revalued Investments 67,1% Land/Building/Equipment 0,5% Intangible Assets 3,7% Prepaid Expenses 100,0% TOTAL ASSETS 12 6 3 15 16,17 14 7,18 8 9,10 11 12 14 20 24 35.417 18.450 113 6./08 948 996 6.361 309 1.532 24.1% 12,6% 0,1% 4.6% 0,6% 0,7% 4,3% 0,29 1,0% 27.246 12.460 32 5.3/5 1.053 1.445 5.507 287 1.087 LIABILITIES & EQUITY 25,0% SHORT TERM LIABILITIES 11,4% Financial Debts (Notes Payble) 0,0% Other Financial liab. 4,9% Accounts Payable 1,0% Provisions for Employee Benefi 1,3% Other Liabilities 5,0% Unearned Revenues 0,3% Provisions 1,0%Other Current Liabilities 50.546) 43.342 7,18 70.659 53.429 7.547 223 0 713 12 14 22 32 34 UZUN VADEL YKMLLKLER 35 Uzun Vadeli Borlanmalar 36 Uzun Vadeli Kiralama Borlar 37 Dier Borlar 38 Ertelenmi Gelirler 39 Uzun Vadeli Karlklar 40 Ertelenmi Vergi Ykmll 41 ZKAYNAKLAR 42 denmi Sermaye 43 Sermaye Dzeltmesi Farklar 44 Yeniden Deerleme (yabanc Para 45 Kardan Ayrlm Kstlanm 46 Gemi Yllar Kar/Zararlar 47 Net Dnem Kari/Zarar 48 Kontrol Gc Olmayan Paylar 49 TOPLAM KAYNAKLAR 48,1% 36,4% 5,1% 0,2% 0,5% 0,7% 5,2% 27,8% 0,9% 0,8% 14,7% 1.069 7.678 40.792 1.380 1.124 21.544 184 12.024 4.536 3 146.871 25 25 25 25 25 25 46,3% LONG TERM LIABILITIES 39,7% Financial Debts 0,0% Leasing Liabilities 0,2% Other Liabilities 0,3% Unearned Revenues 0,6% Provisions for Employee Benefi 5,5% Taxes Payable 28,7% SHAREHOLDERS' EQUITY 1,3% Share Capital 1,0% Inflation Difference on Equity 15,1% Revaluations (Foreign Exchange Reserves 7,5% Retained Earnings 3,7% Net Profit for the Period 0,0% 100,0% TOTAL LIABILITIES & EQUITY 188 342 685 5.989 31.281 1.380 1.124 16.467 59 8.206 4.045 3 109.076 8,2% 3,1% 0,0% 100,0% 50 51 THY 52 Finansal Tablo Tr: Gelir Tablosu 53 Dnem 54 Raporlama Birimi 55 Hasilat 56 Satlarn Maliyeti (-) 57 BRT KAR/ZARAR 58 Genel Ynetim Giderleri (-) Pazarlama, Sat ve Datm 59 Giderleri (-) 60 Esas Faaliyetlerden Dier Gelirler Esas Faaliyetlerden Dier Giderler 61 (-) 62 FAALYET KARI/ZARARI Konsolide Year 2019 Milyon TL 26 75.118 27 62.039) 13.079 28 1.695 Konsolide Year 2018 Milyon TL 100,0% 62.853 82,6% 49.284 17,4% 13.569 2,3% 1.238 Income Statement Period Unit 100,0% Sales Revenues 78,4% Cost of Sales 21,6% Gross Profit 2,0% General Administrative Expens- 28 29 8.015 2.043 10,7% 2,7% 6.185 799 9,8% Sales and Marketing Expenses 1,3% Other Operating Revenues 29 370 5.0421 0,5% 6,7% 753 6.192 1,2% Other Operating Expenses 9,9% Operating Profit Konsolide Year 2019 Milyon TL 26 75.118 27 62.039 13.079 28 1.695 100,0% 82,6% 17,4% 2,3% Konsolide Year 2018 Milyon TL 62.853 49.284 13.569 1.238 Income Statement Period Unit 100,0% Sales Revenues 78,4% Cost of Sales 21,6% Gross Profit 2,0% General Administrative Expens 8.015 28 29 10,7% 2,7% 6.185 799 9,8% Sales and Marketing Expenses 1,3% Other Operating Revenues 2.043 52 Finansal Tablo Tr: Gelir Tablosu 53 Dnem 54 Raporlama Birimi 55 Hasilat 56 Satlarn Maliyeti (-) 57 BRT KAR/ZARAR 58 Genel Ynetim Giderleri (-) Pazarlama, Sat ve Datm 59 Giderleri (-) 60 Esas Faaliyetlerden Dier Gelirler Esas Faaliyetlerden Dier Giderler 61 (-) 62 FAALYET KARI/ZARARI Yatrm Faaliyetlerinden 63 Gelirler/Giderler FINANSMAN NCES FAALYET 64 KARI 65 Finansman Gelirler 66 Finansman Giderler (-) 67 VERG NCES KAR/ZARAR 68 Vergi Gelir/Gideri 69 NET DNEM KARI/ZARARI 29 370 5.042 0,5% 6,7% 753 6.192 1,2% Other Operating Expenses 9,9% Operating Profit 30 980 1,3% 1.142 1,8% Income/Loss From Investments 6.022 780 31 31 1.746 5.056 520 4.536 8,0% 1,0% 2,3% 6,7% 0,7% 6,0% 7.334 753 2.853 5.234 1.189 4.045 11,7% Earnings Before Interest and Ta 1,2% Loss from Investments 4,5% Financial Expenses 8,3% Income Before Tax 1,9% Taxes Expense 6,4% Net Income
Step by Step Solution
There are 3 Steps involved in it

Get step-by-step solutions from verified subject matter experts