

Question: Perform the ANOVA F-test through the following steps: (a) (4 marks) List the major assumptions and requirements for statistical inference using ANOVA. Based on the
Perform the ANOVA F-test through the following steps:
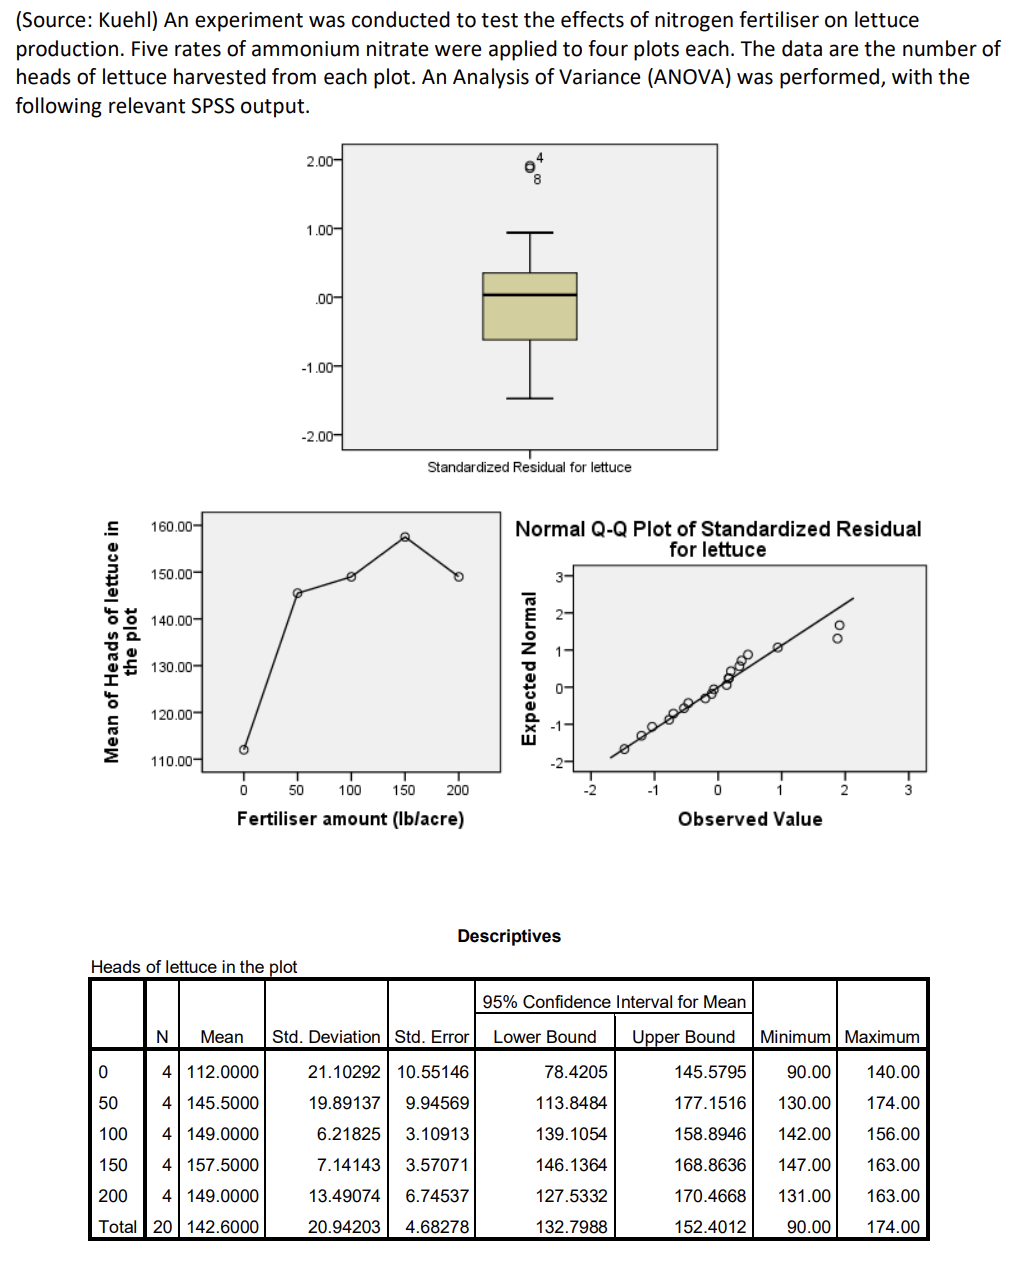
(a) (4 marks) List the major assumptions and requirements for statistical inference using ANOVA. Based on the above information, do any of them appear to be violated? If so, which ones? Justify your answer by providing a reference to the problem statement or the relevant SPSS output.
| Assumptions | Violated? | Reason |
|
|
(b) (1 mark) Write one sentence explaining why no diagnostic plots were given for individual fertiliser levels.
Regardless of your answer for (a), for the remainder of this Question, proceed as if all requirements and assumptions are satisfied.
(c) (2 marks) Define the parameters of interest and write down the null and the alternative hypotheses for the ANOVA F-test.
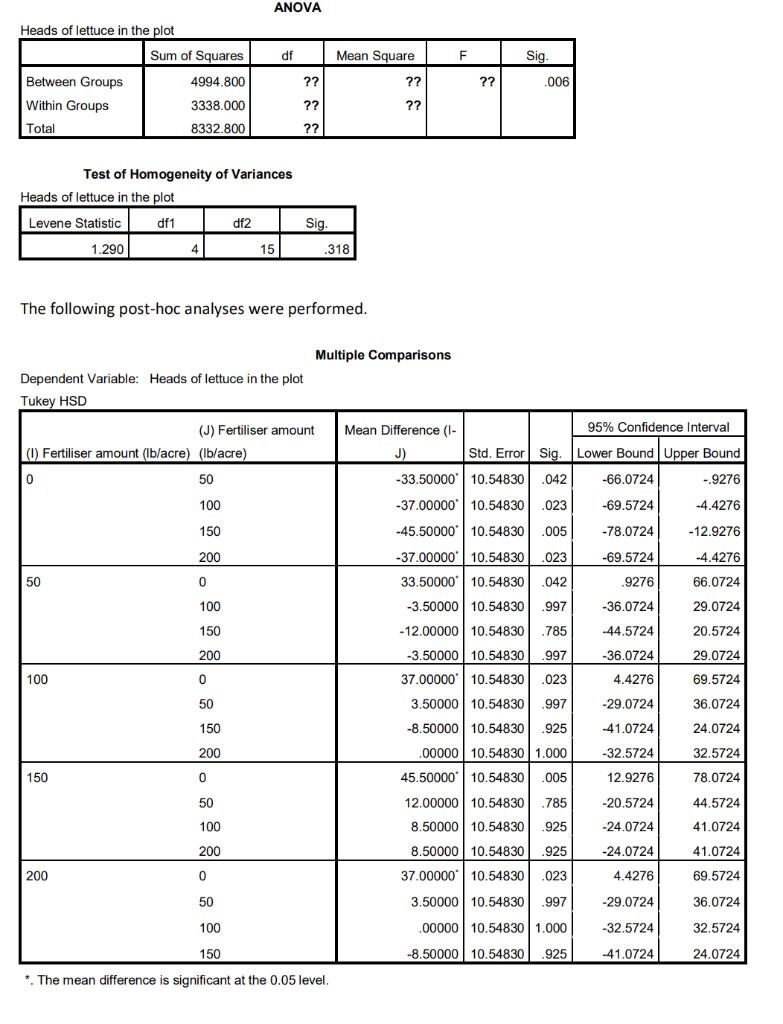
(d) (4 marks) Calculate or obtain and report the test statistic, and its degrees of freedom, if applicable.
(e) (1 mark) Report the p-value, and make the statistical decision at =0.05=0.05.
(f) (1 mark) Write a sentence stating the conclusion in the context of the problem.
Regardless of your answer for the previous questions on Lettuce Production, for this Question, proceed as if the conclusion was that nitrogen fertiliser did have an effect.
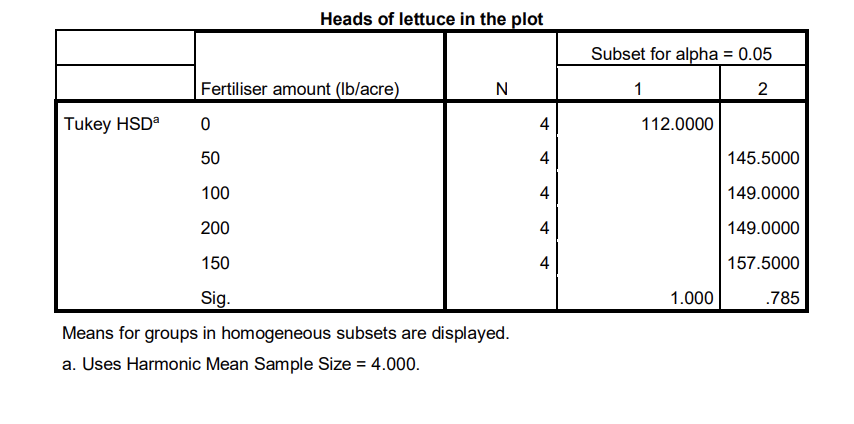
(a) (1 mark) Based on SPSS output, does it appear that more fertiliser can improve lettuce yield? (Be specific, and reference the relevant SPSS output.)
(b) (2 marks) Based on SPSS output, does it appear that more fertiliser always improves lettuce yield? (Be specific, and reference the relevant SPSS output.)
(Source: Kuehl) An experiment was conducted to test the effects of nitrogen fertiliser on lettuce production. Five rates of ammonium nitrate were applied to four plots each. The data are the number of heads of lettuce harvested from each plot. An Analysis of Variance (ANOVA) was performed, with the following relevant SPSS output. 2.00- 8 1.00- .00- -1.00- -2.00- Standardized Residual for lettuce 160.00 Normal Q-Q Plot of Standardized Residual for lettuce 150.00 140.00 Mean of Heads of lettuce in the plot 8 130.00 Expected Normal 120.00 110.00 0 50 T 100 150 200 -1 0 1 Fertiliser amount (lblacre) Observed Value Descriptives Heads of lettuce in the plot 95% Confidence Interval for Mean N Mean Std. Deviation Std. Error Lower Bound Upper Bound Minimum Maximum 0 4 112.0000 21.10292 10.55146 78.4205 145.5795 90.00 140.00 50 4 145.5000 19.89137 9.94569 113.8484 177.1516 130.00 174.00 100 4149.0000 6.21825 3.10913 139.1054 158.8946 142.00 156.00 150 4157.5000 7.14143 3.57071 146.1364 168.8636 147.00 163.00 200 4 149.0000 13.49074 6.74537 127.5332 170.4668 131.00 163.00 Total 20142.6000 20.94203 4.68278 132.7988 152.4012 90.00 174.00 ANOVA df Mean Square F Sig. Heads of lettuce in the plot Sum of Squares Between Groups 4994.800 Within Groups 3338.000 Total 8332.800 ?? ?? .006 ?? ?? 22 ?? Test of Homogeneity of Variances Heads of lettuce in the plot Levene Statistic df1 df2 1.290 4 15 Sig. .318 The following post-hoc analyses were performed. Multiple Comparisons Dependent Variable: Heads of lettuce in the plot Tukey HSD (J) Fertiliser amount (0) Fertiliser amount (lb/acre) (Ib/acre) 0 50 100 150 200 50 0 100 150 200 100 0 Mean Difference (1- 95% Confidence Interval J) Std. Error Sig. Lower Bound Upper Bound -33.50000 10.54830.042 -66.0724 -.9276 -37.00000" 10.54830 .023 -69.5724 -4.4276 -45.50000 10.54830.005 -78.0724 -12.9276 - 37.00000 10.54830 .023 -69.5724 -4.4276 33.50000 10.54830.042 9276 66.0724 -3.50000 10.54830 .997 -36.0724 29.0724 - 12.00000 10.54830.785 -44.5724 20.5724 -3.50000 10.54830 .997 -36.0724 29.0724 37.00000 10.54830 .023 4.4276 69.5724 3.50000 10.54830 .997 -29.0724 36.0724 -8.50000 10.54830 925 -41.0724 24.0724 .00000 10.548301.000 -32.5724 32.5724 45.50000 10.54830.005 12.9276 78.0724 12.00000 10.54830 785 -20.5724 44.5724 8.50000 10.54830 .925 -24.0724 41.0724 8.50000 10.54830 .925 -24.0724 41.0724 37.00000* 10.54830 .023 4.4276 69.5724 3.50000 10.54830 .997 -29.0724 36.0724 .00000 10.548301.000 -32.5724 32.5724 -8.50000 10.54830 .925 -41.0724 24.0724 50 150 200 150 0 50 100 200 200 0 50 100 150 *. The mean difference is significant at the 0.05 level. Heads of lettuce in the plot Subset for alpha = 0.05 Fertiliser amount (Ib/acre) N 1 2 Tukey HSD 0 4 112.0000 50 4 145.5000 100 4 149.0000 200 4 149.0000 150 4 157.5000 1.000 .785 Sig. Means for groups in homogeneous subsets are displayed. a. Uses Harmonic Mean Sample Size = 4.000. (Source: Kuehl) An experiment was conducted to test the effects of nitrogen fertiliser on lettuce production. Five rates of ammonium nitrate were applied to four plots each. The data are the number of heads of lettuce harvested from each plot. An Analysis of Variance (ANOVA) was performed, with the following relevant SPSS output. 2.00- 8 1.00- .00- -1.00- -2.00- Standardized Residual for lettuce 160.00 Normal Q-Q Plot of Standardized Residual for lettuce 150.00 140.00 Mean of Heads of lettuce in the plot 8 130.00 Expected Normal 120.00 110.00 0 50 T 100 150 200 -1 0 1 Fertiliser amount (lblacre) Observed Value Descriptives Heads of lettuce in the plot 95% Confidence Interval for Mean N Mean Std. Deviation Std. Error Lower Bound Upper Bound Minimum Maximum 0 4 112.0000 21.10292 10.55146 78.4205 145.5795 90.00 140.00 50 4 145.5000 19.89137 9.94569 113.8484 177.1516 130.00 174.00 100 4149.0000 6.21825 3.10913 139.1054 158.8946 142.00 156.00 150 4157.5000 7.14143 3.57071 146.1364 168.8636 147.00 163.00 200 4 149.0000 13.49074 6.74537 127.5332 170.4668 131.00 163.00 Total 20142.6000 20.94203 4.68278 132.7988 152.4012 90.00 174.00 ANOVA df Mean Square F Sig. Heads of lettuce in the plot Sum of Squares Between Groups 4994.800 Within Groups 3338.000 Total 8332.800 ?? ?? .006 ?? ?? 22 ?? Test of Homogeneity of Variances Heads of lettuce in the plot Levene Statistic df1 df2 1.290 4 15 Sig. .318 The following post-hoc analyses were performed. Multiple Comparisons Dependent Variable: Heads of lettuce in the plot Tukey HSD (J) Fertiliser amount (0) Fertiliser amount (lb/acre) (Ib/acre) 0 50 100 150 200 50 0 100 150 200 100 0 Mean Difference (1- 95% Confidence Interval J) Std. Error Sig. Lower Bound Upper Bound -33.50000 10.54830.042 -66.0724 -.9276 -37.00000" 10.54830 .023 -69.5724 -4.4276 -45.50000 10.54830.005 -78.0724 -12.9276 - 37.00000 10.54830 .023 -69.5724 -4.4276 33.50000 10.54830.042 9276 66.0724 -3.50000 10.54830 .997 -36.0724 29.0724 - 12.00000 10.54830.785 -44.5724 20.5724 -3.50000 10.54830 .997 -36.0724 29.0724 37.00000 10.54830 .023 4.4276 69.5724 3.50000 10.54830 .997 -29.0724 36.0724 -8.50000 10.54830 925 -41.0724 24.0724 .00000 10.548301.000 -32.5724 32.5724 45.50000 10.54830.005 12.9276 78.0724 12.00000 10.54830 785 -20.5724 44.5724 8.50000 10.54830 .925 -24.0724 41.0724 8.50000 10.54830 .925 -24.0724 41.0724 37.00000* 10.54830 .023 4.4276 69.5724 3.50000 10.54830 .997 -29.0724 36.0724 .00000 10.548301.000 -32.5724 32.5724 -8.50000 10.54830 .925 -41.0724 24.0724 50 150 200 150 0 50 100 200 200 0 50 100 150 *. The mean difference is significant at the 0.05 level. Heads of lettuce in the plot Subset for alpha = 0.05 Fertiliser amount (Ib/acre) N 1 2 Tukey HSD 0 4 112.0000 50 4 145.5000 100 4 149.0000 200 4 149.0000 150 4 157.5000 1.000 .785 Sig. Means for groups in homogeneous subsets are displayed. a. Uses Harmonic Mean Sample Size = 4.000Step by Step Solution
There are 3 Steps involved in it

Get step-by-step solutions from verified subject matter experts