

Question: Performance a Horizontal analysis for the two statements And explain the most significant changes Consilidated Statements of Operations 24-Sep-22 25-Sep-21 26-Sep-20 Net sales: Product $
Performance a Horizontal analysis for the two statements
And explain the most significant changes
| Consilidated Statements of Operations | ||||||
| 24-Sep-22 | 25-Sep-21 | 26-Sep-20 | ||||
| Net sales: | ||||||
| Product | $ 316,199.00 | $ 297,392.00 | $ 220,747.00 | |||
| Service | $ 78,129.00 | $ 68,425.00 | $ 53,768.00 | |||
| Total net sales | $ 394,328.00 | $ 365,817.00 | $ 274,515.00 | |||
| Cost of sales | ||||||
| Products | $ 201,471.00 | $ 192,266.00 | $ 151,286.00 | |||
| Service | $ 22,075.00 | $ 20,715.00 | $ 18,273.00 | |||
| Total cost of sales | $ 223,546.00 | $ 212,981.00 | $ 169,559.00 | |||
| Gross margin | $ 170,782.00 | $ 152,836.00 | $ 104,956.00 | |||
| Operating expenses | ||||||
| Reserch and development | $ 26,251.00 | $ 21,914.00 | $ 18,752.00 | |||
| Selling, general and administrative | $ 25,094.00 | $ 21,973.00 | $ 19,916.00 | |||
| Total operating expenses | $ 51,345.00 | $ 43,887.00 | $ 38,668.00 | |||
| Operating income | $ 119,437.00 | $ 108,949.00 | $ 66,288.00 | |||
| Other income/(expenses), net | $ (334.00) | $ 258.00 | $ 803.00 | |||
| Income before provision for income taxes | $ 119,103.00 | $ 109,207.00 | $ 67,091.00 | |||
| Provision for income taxes | $ 19,300.00 | $ 14,257.00 | $ 9,680.00 | |||
| Net income | $ 99,803.00 | $ 94,680.00 | $ 57,411.00 | |||
| Earning per share | ||||||
| Basic | $ 6.15 | $ 5.67 | $ 3.31 | |||
| Diluted | $ 6.11 | $ 5.61 | $ 3.28 | |||
| Shares used in coputing earning per share | ||||||
| Basic | $ 16,215,963.00 | $ 16,701,272.00 | $ 17,352,119.00 | |||
| Diluted | $ 16,325,819.00 | $ 16,864,919.00 | $ 17,528,214.00 | |||
| CONSOLIDATED BALANCE SHEETS | ||||||
| Assets: | ||||||
| 24-Sep-22 | 25-Sep-21 | 26-Sep-20 | ||||
| Current assets | ||||||
| Cash and cash equivalents | $ 23,646.00 | $ 34,940.00 | $ 38,016.00 | |||
| Marketable securities | $ 24,658.00 | $ 27,699.00 | $ 52,927.00 | |||
| Accounts recivables, net | $ 28,184.00 | $ 26,278.00 | $ 16,120.00 | |||
| Inventories | $ 4,946.00 | $ 6,580.00 | $ 4,061.00 | |||
| Vendor non-trade recivables | $ 32,748.00 | $ 25,228.00 | $ 21,325.00 | |||
| Other current assests | $ 21,223.00 | $ 14,111.00 | $ 11,264.00 | |||
| Total assets | $ 135,405.00 | $ 134,836.00 | $ 143,713.00 | |||
| Non-current assets: | ||||||
| Marketable secrities | $ 120,805.00 | $ 127,877.00 | $ 100,887.00 | |||
| Property, plant and equipment, net | $ 42,117.00 | $ 39,440.00 | $ 36,766.00 | |||
| Other non-current assets | $ 54,428.00 | $ 48,849.00 | $ 42,522.00 | |||
| Total non_current assets | $ 217,350.00 | $ 216,166.00 | $ 180,175.00 | |||
| Total assets | $ 352,755.00 | $ 351,002.00 | $ 323,888.00 | |||
| liabilities ans shareholder's equity | ||||||
| Current Liabilities | ||||||
| Account payable | $ 64,115.00 | $ 54,763.00 | $ 42,296.00 | |||
| Other current liabilities | $ 60,845.00 | $ 47,493.00 | $ 42,684.00 | |||
| Deferred revenue | $ 7,912.00 | $ 7,612.00 | $ 6,643.00 | |||
| cimmercial paper | $ 9,982.00 | $ 6,000.00 | $ 4,996.00 | |||
| term debt | $ 11,128.00 | $ 9,613.00 | $ 8,773.00 | |||
| Total current liabilities | $ 153,982.00 | $ 125,481.00 | $ 105,392.00 | |||
| Non-current liabilities | ||||||
| Term debt | $ 98,959.00 | $ 109,106.00 | $ 98,667.00 | |||
| Other non-current liabilities | $ 49,142.00 | $ 53,325.00 | $ 54,490.00 | |||
| Total non-current liabilities | $ 148,101.00 | $ 162,431.00 | $ 153,157.00 | |||
| Total liabilities | $ 302,083.00 | $ 287,912.00 | $ 258,549.00 | |||
| Commitment and contingencies | ||||||
| Shareholdes' equity: | ||||||
| Common stock and additional paid-in capital, $0.00001 par value: 50,400,000 shares authorized; 15,943,425 and 16,426,786 shares issued and outstanding, respectively | $ 64,849.00 | $ 57,365.00 | $ 50,779.00 | |||
| Retained earnings/(Accumulated deficit) | $ (3,068.00) | $ 5,562.00 | $ 14,966.00 | |||
| Accumulated other comprehensive income/(loss) | $ (11,109.00) | $ 163.00 | $ (406.00) | |||
| Total shareholders' equity | $ 50,672.00 | $ 63,090.00 | $ 65,339.00 | |||
| Total liabilities and shareholders' equity | $ 352,755.00 | $ 351,002.00 | $ 323,888.00 | |||
| Dividends and dividend equivalents declared per share or RSU |
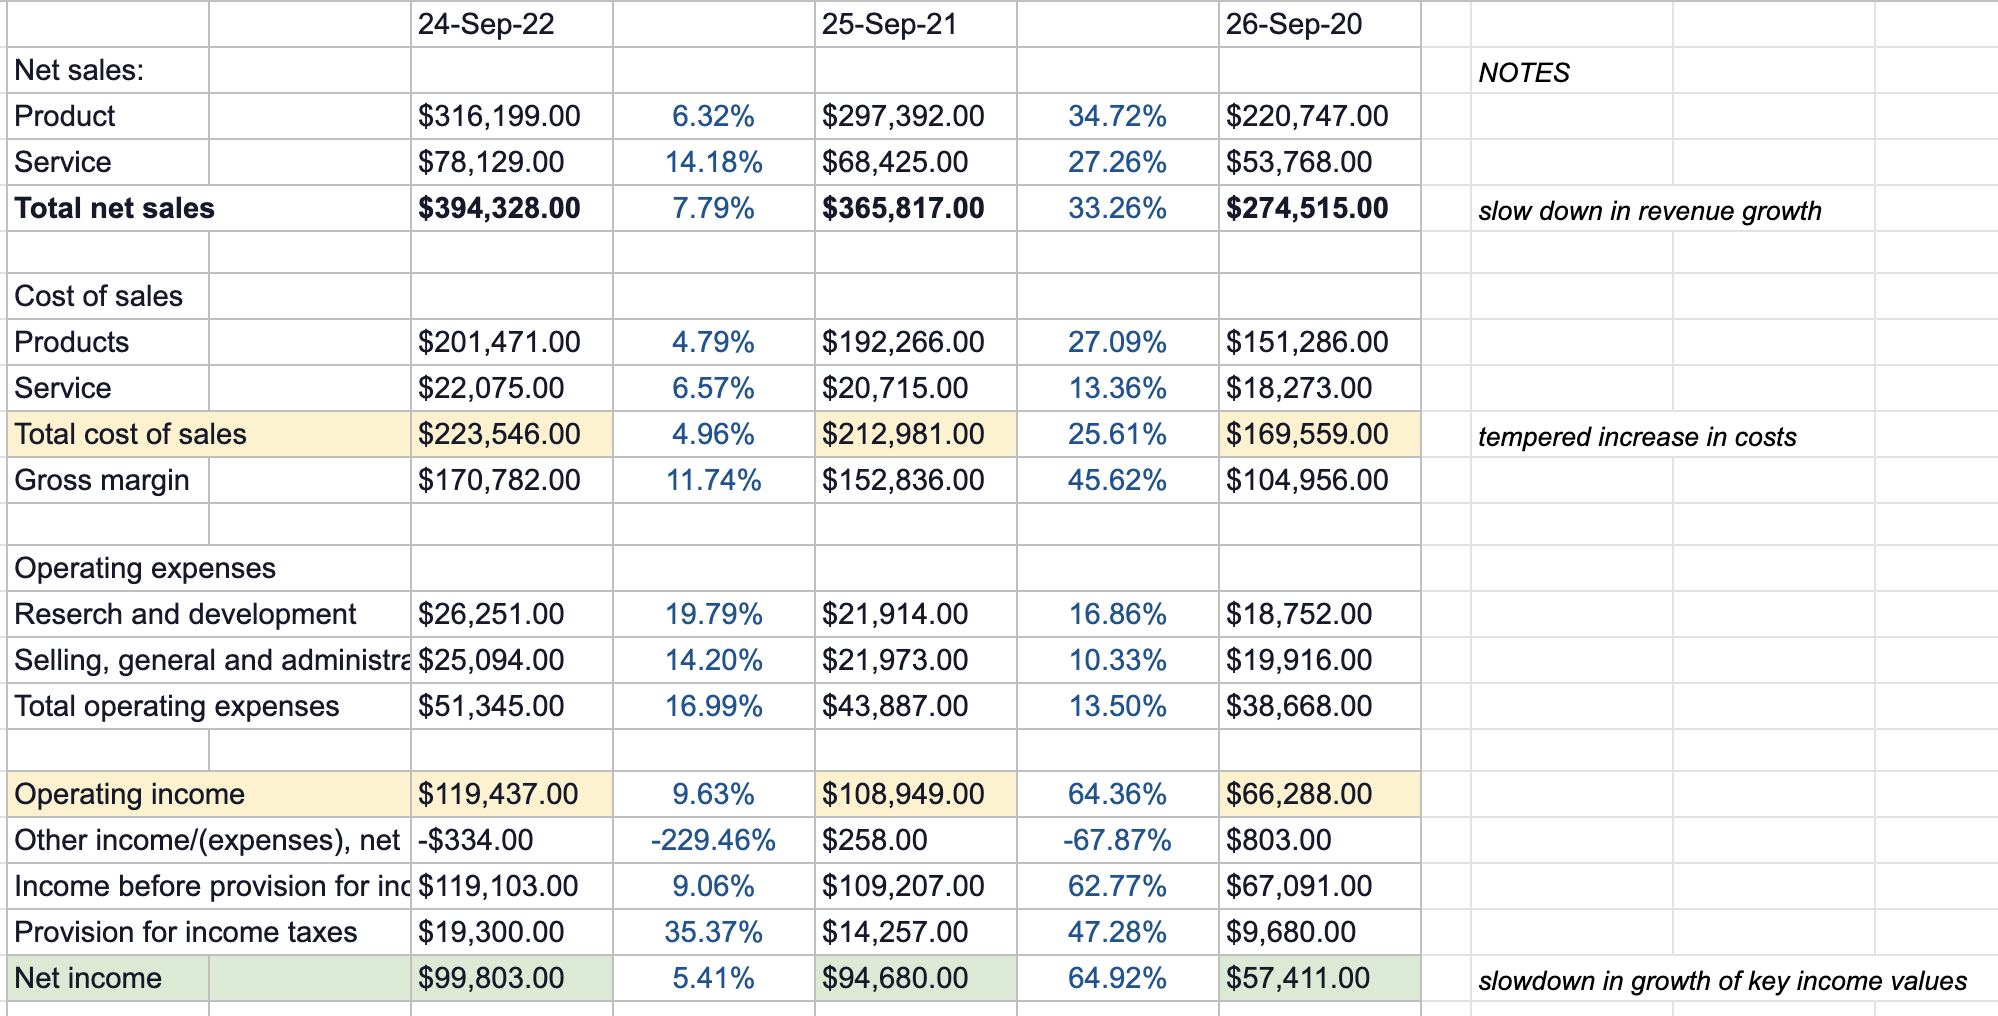
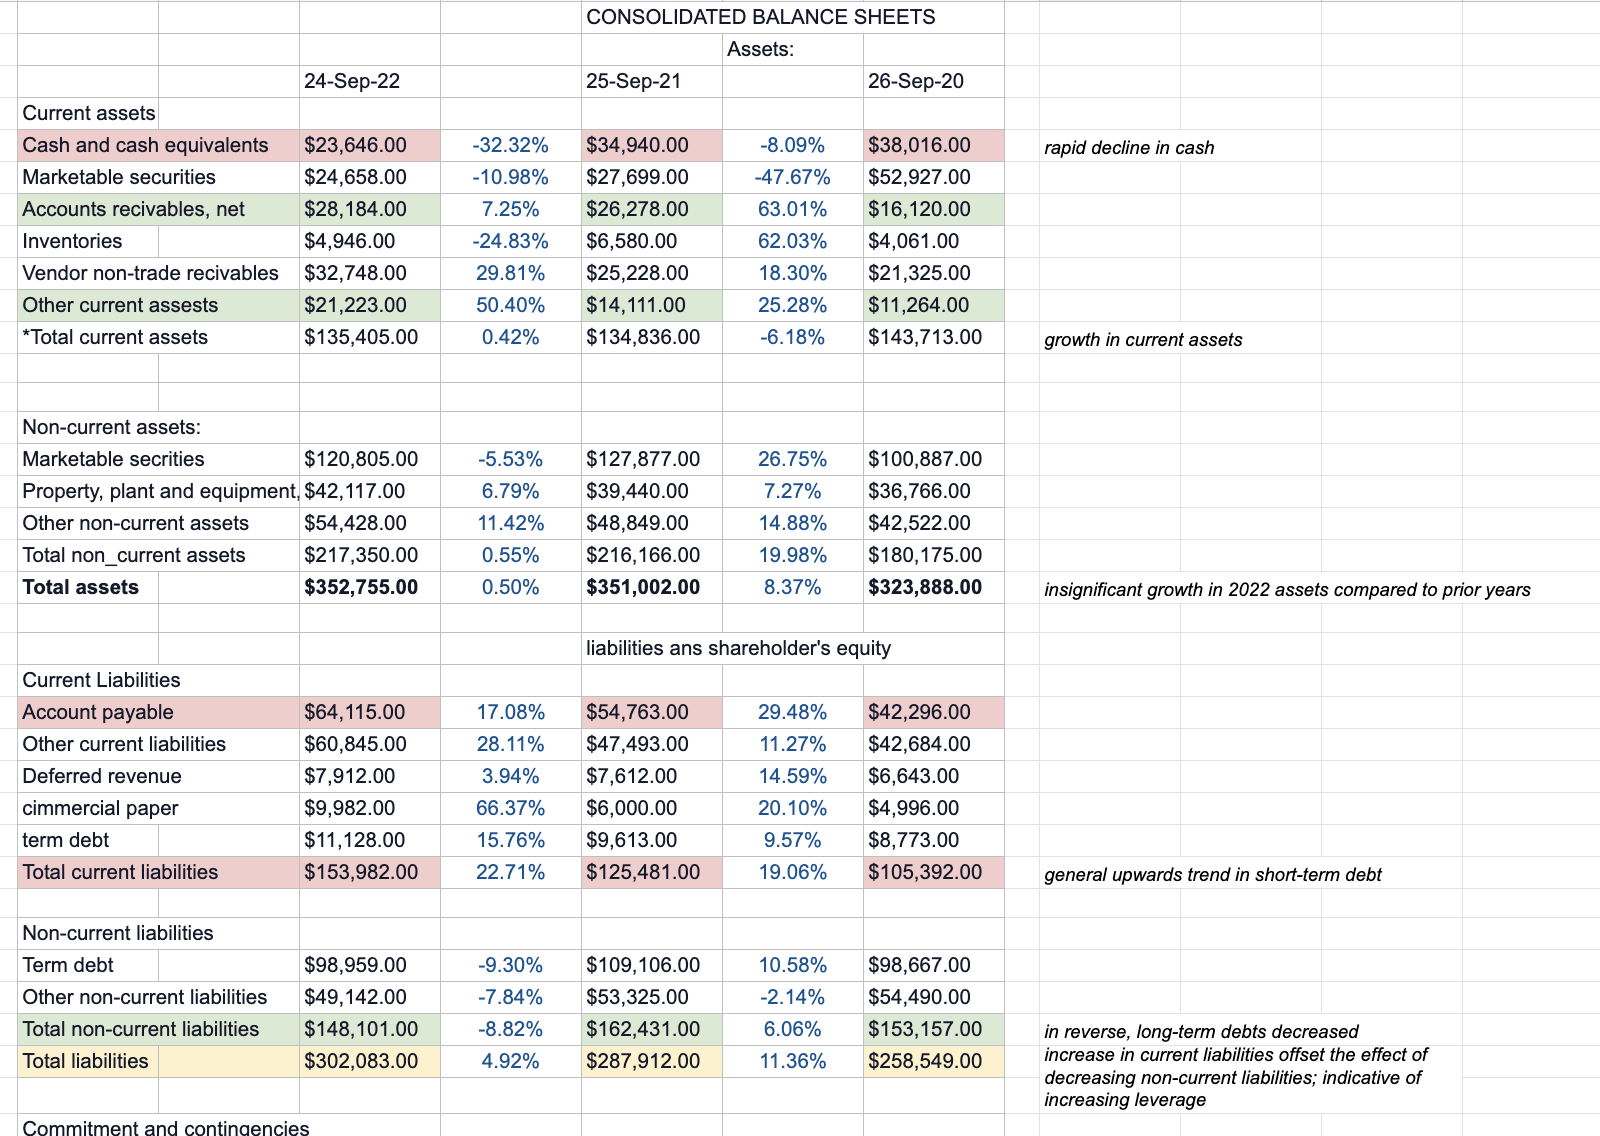
24-Sep-22 Net sales: Product $316,199.00 Service $78,129.00 Total net sales $394,328.00 Cost of sales Products $201,471.00 Service $22,075.00 Total cost of sales $223,546.00 Gross margin $170,782.00 Operating expenses Reserch and development $26,251.00 Selling, general and administrz $25,094.00 Total operating expenses $51,345.00 Operating income $119,437.00 Other income/(expenses), net -$334.00 Income before provision for inc $119,103.00 Provision for income taxes $19,300.00 Net income $99,803.00 6.32% 14.18% 7.79% 4.79% 6.57% 4.96% 11.74% 19.79% 14.20% 16.99% 9.63% -229.46% 9.06% 35.37% 5.41% 25-Sep-21 $297,392.00 $68,425.00 $365,817.00 $192,266.00 $20,715.00 $212,981.00 $152,836.00 $21,914.00 $21,973.00 $43,887.00 $108,949.00 $258.00 $109,207.00 $14,257.00 $94,680.00 34.72% 27.26% 33.26% 27.09% 13.36% 25.61% 45.62% 16.86% 10.33% 13.50% 64.36% -67.87% 62.77% 47.28% 64.92% 26-Sep-20 $220,747.00 $53,768.00 $274,515.00 $151,286.00 $18,273.00 $169,559.00 $104,956.00 $18,752.00 $19,916.00 $38,668.00 $66,288.00 $803.00 $67,091.00 $9,680.00 $57,411.00 NOTES slow down in revenue growth tempered increase in costs slowdown in growth of key income values CONSOLIDATED BALANCE SHEETS Assets: 24-Sep-22 25-Sep-21 26-Sep-20 Current assets Cash and cash equivalents $23,646.00 -32.32% $34,940.00 -8.09% $38,016.00 rapid decline in cash Marketable securities $24,658.00 -10.98% $27,699.00 47.67% $52,927.00 Accounts recivables, net $28, 184.00 7.25% $26,278.00 63.01% $16, 120.00 Inventories $4,946.00 -24.83% $6,580.00 62.03% $4,061.00 Vendor non-trade recivables $32,748.00 29.81% $25,228.00 18.30% $21,325.00 Other current assests $21,223.00 50.40% $14, 111.00 25.28% $11,264.00 Total current assets $135,405.00 0.42% $134,836.00 -6.18% $143,713.00 growth in current assets Non-current assets: Marketable secrities $120,805.00 -5.53% $127,877.00 26.75% $100,887.00 Property, plant and equipment, $42, 117.00 6.79% $39,440.00 7.27% $36,766.00 Other non-current assets $54,428.00 11.42% $48,849.00 14.88% $42,522.00 Total non_current assets $217,350.00 0.55% $216, 166.00 19.98% $180, 175.00 Total assets $352,755.00 0.50% $351,002.00 8.37% $323,888.00 insignificant growth in 2022 assets compared to prior years liabilities ans shareholder's equity Current Liabilities Account payable $64, 115.00 17.08% $54,763.00 29.48% $42,296.00 Other current liabilities $60,845.00 28.11% $47,493.00 11.27% $42,684.00 Deferred revenue $7,912.00 3.94% $7,612.00 14.59% $6,643.00 cimmercial paper $9,982.00 66.37% $6,000.00 20.10% $4,996.00 term debt $11, 128.00 15.76% $9,613.00 9.57% $8,773.00 Total current liabilities $153,982.00 22.71% $125,481.00 19.06% $105,392.00 general upwards trend in short-term debt Non-current liabilities Term debt $98,959.00 -9.30% $109, 106.00 10.58% $98,667.00 Other non-current liabilities $49, 142.00 -7.84% $53,325.00 -2.14% $54,490.00 Total non-current liabilities $148, 101.00 -8.82% $162,431.00 6.06% $153, 157.00 in reverse, long-term debts decreased Total liabilities $302,083.00 4.92% $287,912.00 11.36% $258,549.00 increase in current liabilities offset the effect of decreasing non-current liabilities; indicative of increasing leverage
Step by Step Solution
There are 3 Steps involved in it

Get step-by-step solutions from verified subject matter experts