

Question: performance report LO P1, P2, A1 Phoenix Companys 2015 master budget included the following fixed budget report. It is based on an expected production and
performance report LO P1, P2, A1
| Phoenix Companys 2015 master budget included the following fixed budget report. It is based on an expected production and sales volume of 17,000 units. |
| PHOENIX COMPANY Fixed Budget Report For Year Ended December 31, 2015 |
| Sales | $ | 4,250,000 | |||
| Cost of goods sold | |||||
| Direct materials | $ | 1,190,000 | |||
| Direct labor | 255,000 | ||||
| Machinery repairs (variable cost) | 51,000 | ||||
| Depreciationplant equipment (straight-line) | 330,000 | ||||
| Utilities ($34,000 is variable) | 194,000 | ||||
| Plant management salaries | 200,000 | 2,220,000 | |||
| Gross profit | 2,030,000 | ||||
| Selling expenses | |||||
| Packaging | 68,000 | ||||
| Shipping | 102,000 | ||||
| Sales salary (fixed annual amount) | 260,000 | 430,000 | |||
| General and administrative expenses | |||||
| Advertising expense | 127,000 | ||||
| Salaries | 251,000 | ||||
| Entertainment expense | 90,000 | 468,000 | |||
| Income from operations | $ | 1,132,000 | |||
| Phoenix Companys actual income statement for 2015 follows. |
| PHOENIX COMPANY Statement of Income from Operations For Year Ended December 31, 2015 |
| Sales (20,000 units) | $ | 5,063,000 | |||
| Cost of goods sold | |||||
| Direct materials | $ | 1,417,000 | |||
| Direct labor | 308,000 | ||||
| Machinery repairs (variable cost) | 52,000 | ||||
| Depreciationplant equipment (straight-line) | 330,000 | ||||
| Utilities (fixed cost is $157,500) | 196,750 | ||||
| Plant management salaries | 209,000 | 2,512,750 | |||
| Gross profit | 2,550,250 | ||||
| Selling expenses | |||||
| Packaging | 77,000 | ||||
| Shipping | 112,000 | ||||
| Sales salary (annual) | 277,000 | 466,000 | |||
| General and administrative expenses | |||||
| Advertising expense | 136,000 | ||||
| Salaries | 251,000 | ||||
| Entertainment expense | 93,500 | 480,500 | |||
| Income from operations | $ | 1,603,750 | |||
| Required: | |
| 1. | Prepare a flexible budget performance report for 2015. |
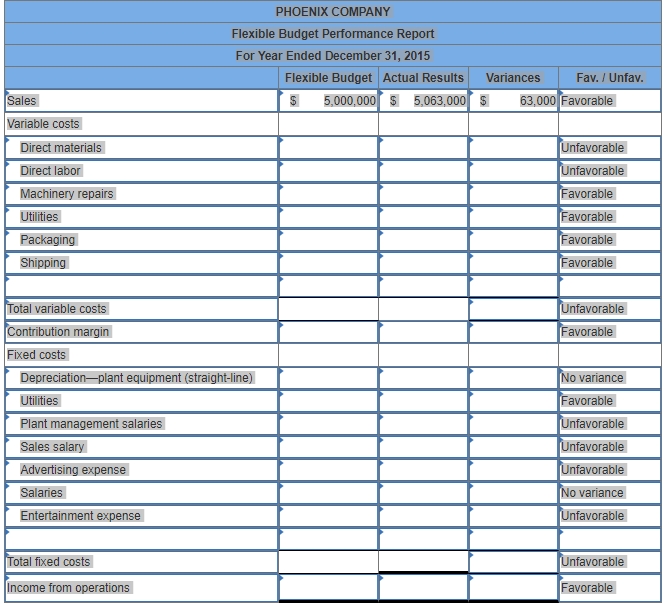
PHOENIX COMPANY Flexible Budget Performance Report For Year Ended December 31, 2015 Flexible Budget Actual ResultsVariances Fav./Unfav Sales 5,000.00ofs 5,063,000S 63,000Favorable Variable costs Direct materials Direct labor Machinery repairs Utilities Unfavorable Unfavorable Favorable Favorable avorable Favorable Shipping otal variable costs Unfavorable Favorable Fixed costs Depreciation-plant equipment (straight-line) Utilities Plant management salaries Sales salary Advertising expense Salaries Entertainment expense o variance Favorable rable Unfavorable Unfavorable rable otal fixed costs Unfavorable Income from operations Favorable
Step by Step Solution
There are 3 Steps involved in it

Get step-by-step solutions from verified subject matter experts