

Question: Performance Tasks PT1-Regression Analysis Do the following. 2. 3. 4. Fit a simple linear regression model to these data. Plot the residuals against time.
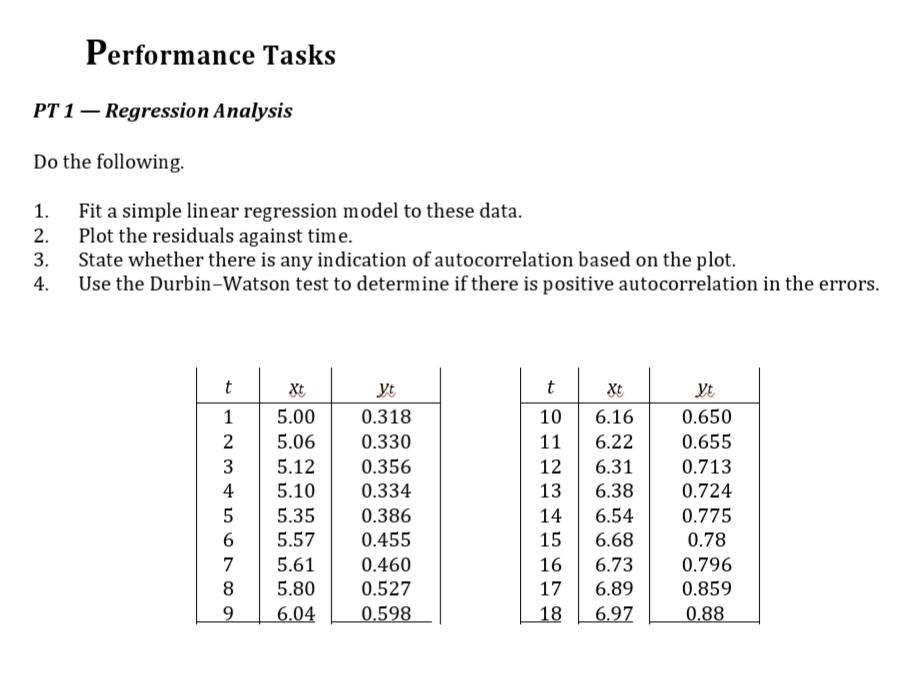
Performance Tasks PT1-Regression Analysis Do the following. 2. 3. 4. Fit a simple linear regression model to these data. Plot the residuals against time. State whether there is any indication of autocorrelation based on the plot. Use the Durbin-Watson test to determine if there is positive autocorrelation in the errors. t 123 3 4 5 6 Xt 5.00 5.06 5.12 5.10 5.35 5.57 7 5.61 8 5.80 9 6.04 Yt 0.318 0.330 0.356 0.334 0.386 0.455 0.460 0.527 0.598 t Xt 10 6.16 11 6.22 12 6.31 13 6.38 6.54 6.68 16 6.73 17 6.89 18 6.97 14 15 Yt 0.650 0.655 0.713 0.724 0.775 0.78 0.796 0.859 0.88
Step by Step Solution
3.38 Rating (142 Votes )
There are 3 Steps involved in it

Get step-by-step solutions from verified subject matter experts