

Question: Period obs1 obs2 obs3 obs4 Sample Mean Sample Range 1 0.48 0.49 0.51 0.5 0.495 0.03 2 0.46 0.45 0.45 0.49 0.4625 0.04 3 0.51
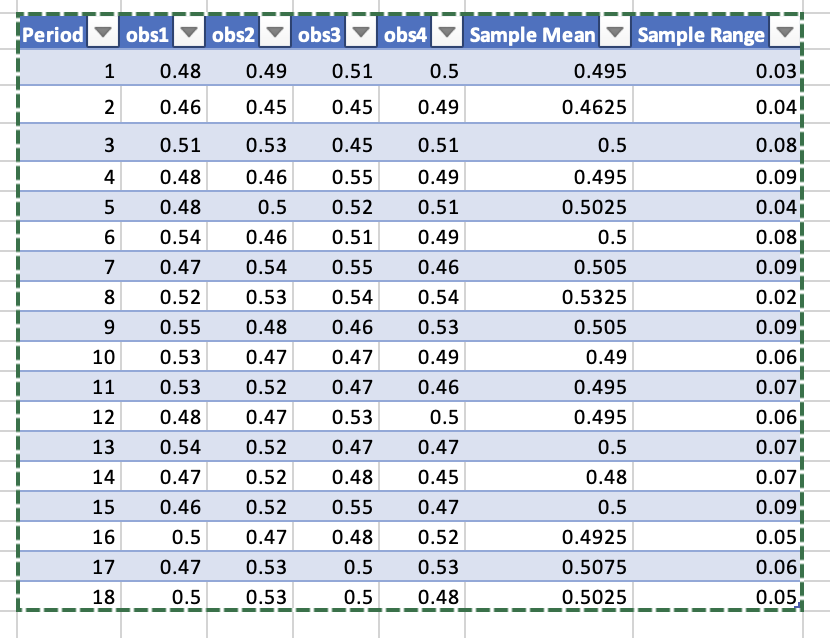
Period obs1 obs2 obs3 obs4 Sample Mean Sample Range
1 0.48 0.49 0.51 0.5 0.495 0.03
2 0.46 0.45 0.45 0.49 0.4625 0.04
3 0.51 0.53 0.45 0.51 0.5 0.08
4 0.48 0.46 0.55 0.49 0.495 0.09
5 0.48 0.5 0.52 0.51 0.5025 0.04
6 0.54 0.46 0.51 0.49 0.5 0.08
7 0.47 0.54 0.55 0.46 0.505 0.09
8 0.52 0.53 0.54 0.54 0.5325 0.02
9 0.55 0.48 0.46 0.53 0.505 0.09
10 0.53 0.47 0.47 0.49 0.49 0.06
11 0.53 0.52 0.47 0.46 0.495 0.07
12 0.48 0.47 0.53 0.5 0.495 0.06
13 0.54 0.52 0.47 0.47 0.5 0.07
14 0.47 0.52 0.48 0.45 0.48 0.07
15 0.46 0.52 0.55 0.47 0.5 0.09
16 0.5 0.47 0.48 0.52 0.4925 0.05
17 0.47 0.53 0.5 0.53 0.5075 0.06
18 0.5 0.53 0.5 0.48 0.5025 0.05
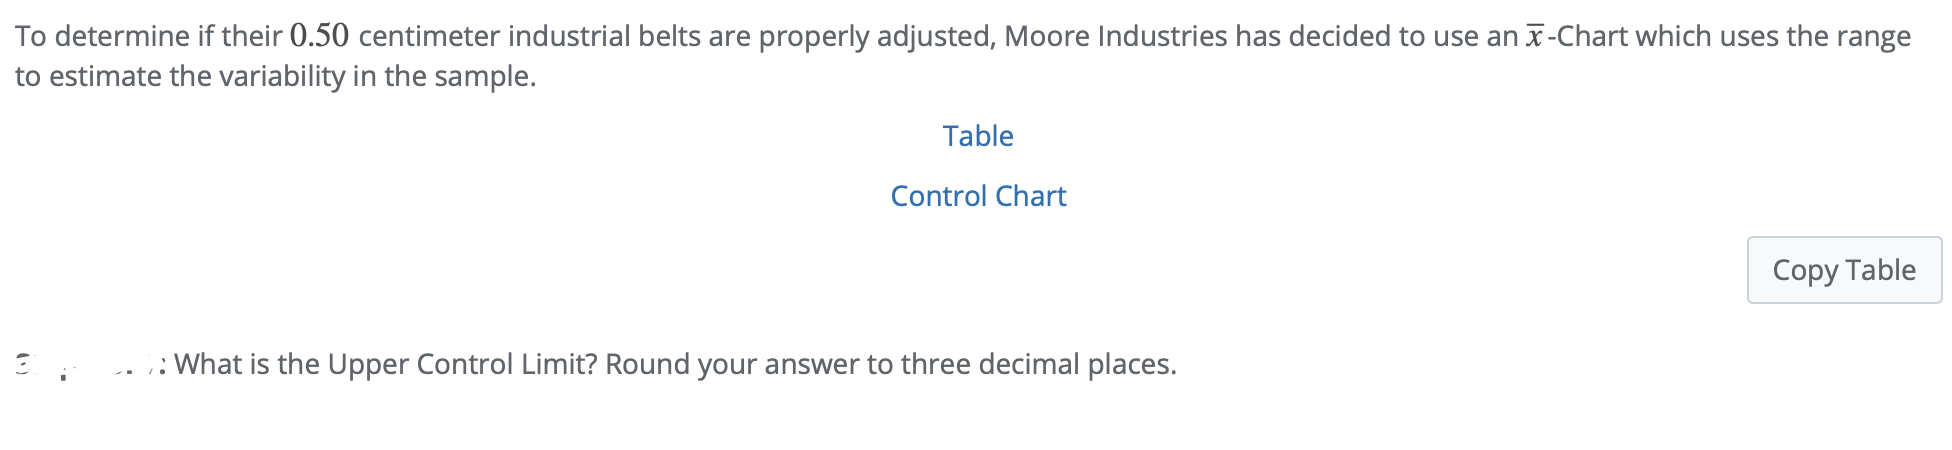
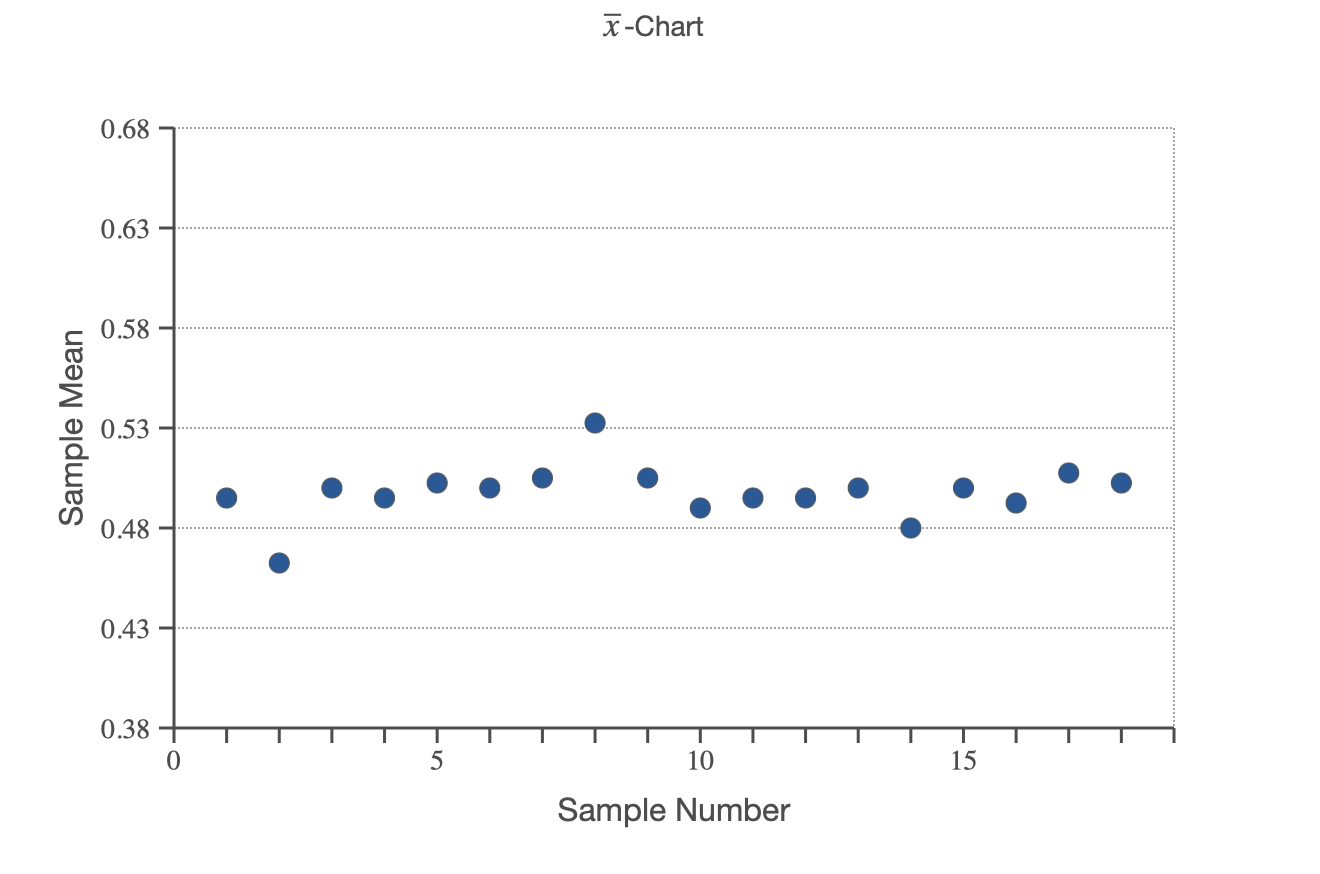
To determine if their 0.50 centimeter industrial belts are properly adjusted, Moore Industries has decided to use an Tc-Chart which uses the range to estimate the variability in the sample. Table Control Chart Copy Table _ _. 4. .:What is the Upper Control Limit? Round your answer to three decimal places. x-Chart 0.68 0.63 0.58 Sample Mean 0.53 0.48 0.43 0.38 - 0 UI 10 15 Sample NumberPeriod obs1 obs2 obs3 obs4 Sample Mean Sample Range 0.48 0.49 0.51 0.5 0.495 0.03 2 0.46 0.45 0.45 0.49 0.4625 0.04 3 0.51 0.53 0.45 0.51 0.5 0.08 4 0.48 0.46 0.55 0.49 0.495 0.09 5 0.48 0.5 0.52 0.51 0.5025 0.04 6 0.54 0.46 0.51 0.49 0.5 0.08 0.47 0.54 0.55 0.46 0.505 0.09 8 0.52 0.53 0.54 0.54 0.5325 0.02 9 0.55 0.48 0.46 0.53 0.505 0.09 10 0.53 0.47 0.47 0.49 0.49 0.06 11 0.53 0.52 0.47 0.46 0.495 0.07 12 0.48 0.47 0.53 0.5 0.495 0.06 13 0.54 0.52 0.47 0.47 0.5 0.07 14 0.47 0.52 0.48 0.45 0.48 0.07 15 0.46 0.52 0.55 0.47 0.5 0.09 16 0.5 0.47 0.48 0.52 0.4925 0.05 17 0.47 0.53 0.5 0.53 0.5075 0.06 18 0.5 0.53 0.5 0.48 0.5025 0.05
Step by Step Solution
There are 3 Steps involved in it

Get step-by-step solutions from verified subject matter experts