

Question: Period Portfolio A Portfolio B Factor 1 Factor 2 Factor 3 1 1.06% 0.00% 0.01% -0.93% -1.70% 2 7.66 6.67 6.87 0.33 -1.24 3 4.93
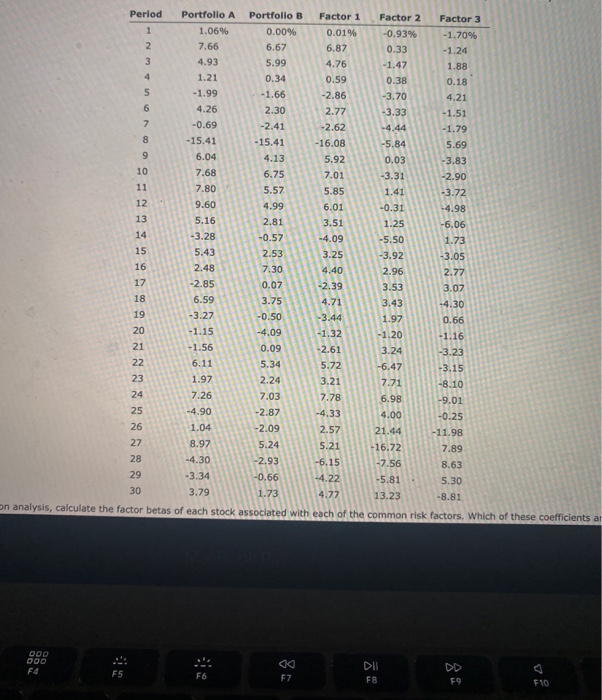
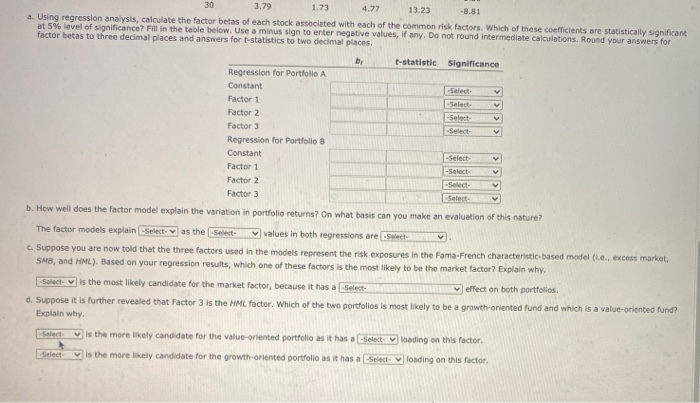
Period Portfolio A Portfolio B Factor 1 Factor 2 Factor 3 1 1.06% 0.00% 0.01% -0.93% -1.70% 2 7.66 6.67 6.87 0.33 -1.24 3 4.93 5.99 4.76 -1.47 1.88 1.21 0.34 0.59 0.38 0.18 5 -1.99 -1.66 -2.86 -3.70 4.21 6 4.26 2.30 2.77 -3.33 -1.51 7 -0.69 -2.41 -2.62 -4.44 -1.79 8 -15.41 -15.41 -16.08 -5.84 5.69 9 6.04 4.13 5.92 0.03 -3.83 10 7.68 6.75 7.01 -3.31 -2.90 11 7.80 5.57 5.85 1.41 -3.72 12 9.60 4.99 6.01 -0.31 -4.98 13 5.16 2.81 3.51 1.25 -6.06 14 -3.28 -0.57 -4.09 -5.50 1.73 15 5.43 2.53 3.25 -3.92 -3.05 16 2.48 7.30 4.40 2.96 2.77 17 -2.85 0.07 -2.39 3.53 3.07 18 6.59 3.75 4.71 3.43 -4.30 19 -3.27 -0.50 -3.44 1.97 0.66 20 -1.15 -4.09 -1.32 -1.20 -1.16 21 -1.56 0.09 -2.61 3.24 -3.23 22 6.11 5.34 5.72 -6.47 -3.15 23 1.97 2.24 3.21 7.71 -8.10 24 7.26 7.03 7.78 6.98 -9.01 25 -4.90 -2.87 -4.33 4.00 -0.25 26 1.04 -2.09 21.44 -11.98 27 8.97 5.24 5.21 -16.72 7.89 28 -4.30 -2.93 -6.15 -7.56 29 -3.34 -0.66 -4.22 -5.81 30 3.79 1.73 4.77 13.23 -8.81 an analysis, calculate the factor betas of each stock associated with each of the common risk factors. Which of these coefficients ar 2.57 8.63 5.30 000 000 F4 FS F7 F8 F9 F10 V 30 3.79 1.73 4.77 13.23 -8.81 a. Using regression analysis, calculate the factor betas of each stock associated with each of the common risk factors. Which of these coefficients are statistically significant at 5% level of significance? Fill in the table below. Use a minus sign to enter negative values, if any. Do not round Intermediate calculations. Round your answers for factor betas to three decimal places and answers for t-statistics to two decimal places by t-statistic Significance Regression for Portfolio A Constant -Select- Factor 1 -Select Factor 2 Select- Factor 3 Select Regression for Portfolio B Constant -Select Factor 1 -Select Factor 2 Factor 3 Select b. How well does the factor model explain the variation in portfolio returns? On what basis can you make an evaluation of this nature? The factor models explain Select as the Select values in both regressions are Select c. Suppose you are now told that the three factors used in the models represent the risk exposures in the Fama French characteristic-based model (1.e., excess market, SMB, and HML). Based on your regression results, which one of these factors is the most likely to be the market factor? Explain why -Select is the most likely candidate for the market factor, because it has a Select- effect on both portfolios. d. Suppose it is further revealed that Factor 3 is the MML factor. Which of the two portfolios is most likely to be a growth-oriented fund and which is a value-oriented rund? Explain why is the more likely candidate for the value-oriented portfolio as it has a Select vloading on this factor. Select is the more likely candidate for the growth-oriented portfolio as it has a select y loading on this factor. Period Portfolio A Portfolio B Factor 1 Factor 2 Factor 3 1 1.06% 0.00% 0.01% -0.93% -1.70% 2 7.66 6.67 6.87 0.33 -1.24 3 4.93 5.99 4.76 -1.47 1.88 1.21 0.34 0.59 0.38 0.18 5 -1.99 -1.66 -2.86 -3.70 4.21 6 4.26 2.30 2.77 -3.33 -1.51 7 -0.69 -2.41 -2.62 -4.44 -1.79 8 -15.41 -15.41 -16.08 -5.84 5.69 9 6.04 4.13 5.92 0.03 -3.83 10 7.68 6.75 7.01 -3.31 -2.90 11 7.80 5.57 5.85 1.41 -3.72 12 9.60 4.99 6.01 -0.31 -4.98 13 5.16 2.81 3.51 1.25 -6.06 14 -3.28 -0.57 -4.09 -5.50 1.73 15 5.43 2.53 3.25 -3.92 -3.05 16 2.48 7.30 4.40 2.96 2.77 17 -2.85 0.07 -2.39 3.53 3.07 18 6.59 3.75 4.71 3.43 -4.30 19 -3.27 -0.50 -3.44 1.97 0.66 20 -1.15 -4.09 -1.32 -1.20 -1.16 21 -1.56 0.09 -2.61 3.24 -3.23 22 6.11 5.34 5.72 -6.47 -3.15 23 1.97 2.24 3.21 7.71 -8.10 24 7.26 7.03 7.78 6.98 -9.01 25 -4.90 -2.87 -4.33 4.00 -0.25 26 1.04 -2.09 21.44 -11.98 27 8.97 5.24 5.21 -16.72 7.89 28 -4.30 -2.93 -6.15 -7.56 29 -3.34 -0.66 -4.22 -5.81 30 3.79 1.73 4.77 13.23 -8.81 an analysis, calculate the factor betas of each stock associated with each of the common risk factors. Which of these coefficients ar 2.57 8.63 5.30 000 000 F4 FS F7 F8 F9 F10 V 30 3.79 1.73 4.77 13.23 -8.81 a. Using regression analysis, calculate the factor betas of each stock associated with each of the common risk factors. Which of these coefficients are statistically significant at 5% level of significance? Fill in the table below. Use a minus sign to enter negative values, if any. Do not round Intermediate calculations. Round your answers for factor betas to three decimal places and answers for t-statistics to two decimal places by t-statistic Significance Regression for Portfolio A Constant -Select- Factor 1 -Select Factor 2 Select- Factor 3 Select Regression for Portfolio B Constant -Select Factor 1 -Select Factor 2 Factor 3 Select b. How well does the factor model explain the variation in portfolio returns? On what basis can you make an evaluation of this nature? The factor models explain Select as the Select values in both regressions are Select c. Suppose you are now told that the three factors used in the models represent the risk exposures in the Fama French characteristic-based model (1.e., excess market, SMB, and HML). Based on your regression results, which one of these factors is the most likely to be the market factor? Explain why -Select is the most likely candidate for the market factor, because it has a Select- effect on both portfolios. d. Suppose it is further revealed that Factor 3 is the MML factor. Which of the two portfolios is most likely to be a growth-oriented fund and which is a value-oriented rund? Explain why is the more likely candidate for the value-oriented portfolio as it has a Select vloading on this factor. Select is the more likely candidate for the growth-oriented portfolio as it has a select y loading on this factor
Step by Step Solution
There are 3 Steps involved in it

Get step-by-step solutions from verified subject matter experts