Question: Person Based Structures In this assignment, you are asked to use the results of a salary survey and map out the pay levels for a
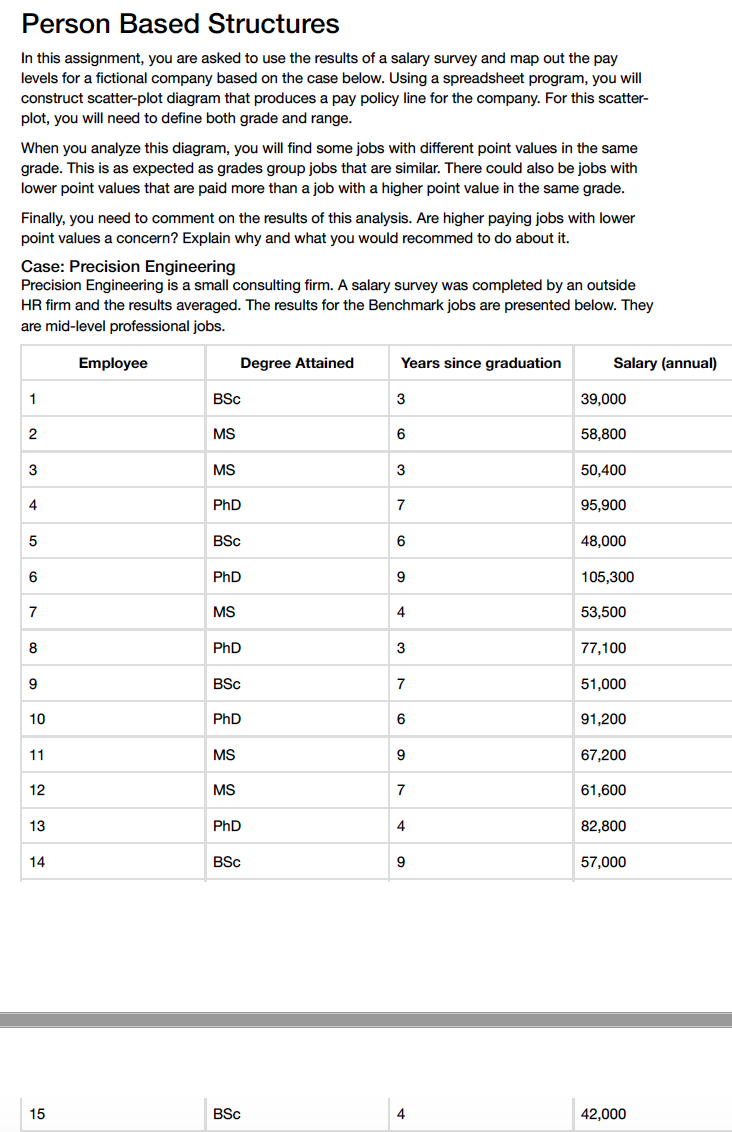
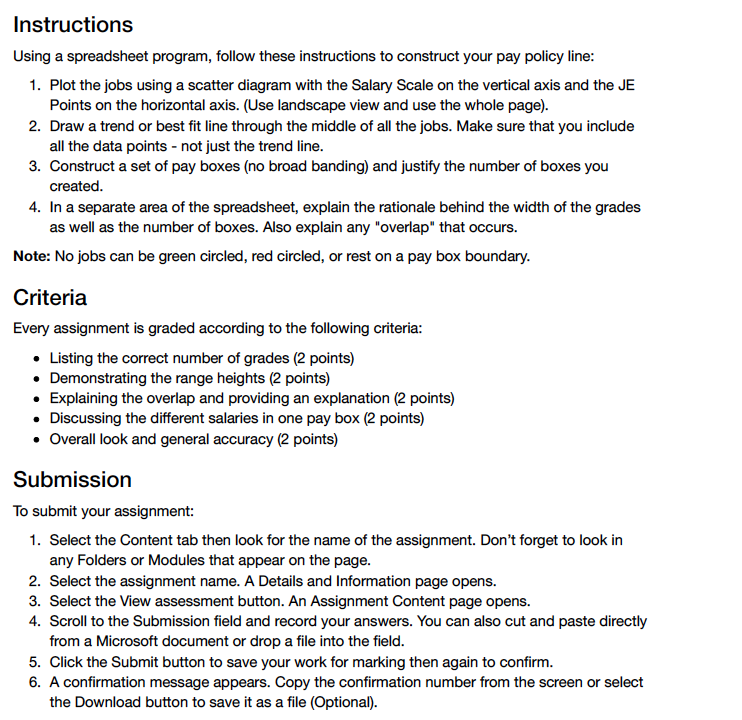
Person Based Structures In this assignment, you are asked to use the results of a salary survey and map out the pay levels for a fictional company based on the case below. Using a spreadsheet program, you will construct scatter-plot diagram that produces a pay policy line for the company. For this scatter- plot, you will need to define both grade and range. When you analyze this diagram, you will find some jobs with different point values in the same grade. This is as expected as grades group jobs that are similar. There could also be jobs with lower point values that are paid more than a job with a higher point value in the same grade. Finally, you need to comment on the results of this analysis. Are higher paying jobs with lower point values a concern? Explain why and what you would recommed to do about it. Case: Precision Engineering Precision Engineering is a small consulting firm. A salary survey was completed by an outside HR firm and the results averaged. The results for the Benchmark jobs are presented below. They are mid-level professional jobs. Employee Degree Attained Years since graduation Salary (annual) 1 BSc 3 39,000 2 MS 6 58,800 3 MS 3 50,400 4 PhD 7 95,900 5 BSc 6 48,000 PhD CO 105,300 7 MS 53,500 8 PhD 3 77,100 9 BSc 51,000 10 PhD 6 91,200 11 MS g 67,200 12 MS 61,600 13 PhD 82,800 14 BSc 57,000 15 BSC 4 42,000Instructions Using a spreadsheet program, follow these instructions to construct your pay policy line: 1. Plot the jobs using a scatter diagram with the Salary Scale on the vertical axis and the JE Points on the horizontal axis. (Use landscape view and use the whole page). 2. Draw a trend or best fit line through the middle of all the jobs. Make sure that you include all the data points - not just the trend line. 3. Construct a set of pay boxes (no broad banding) and justify the number of boxes you created. 4. In a separate area of the spreadsheet, explain the rationale behind the width of the grades as well as the number of boxes. Also explain any "overlap" that occurs. Note: No jobs can be green circled, red circled, or rest on a pay box boundary. Criteria Every assignment is graded according to the following criteria: . Listing the correct number of grades (2 points) . Demonstrating the range heights (2 points) . Explaining the overlap and providing an explanation (2 points) . Discussing the different salaries in one pay box (2 points) . Overall look and general accuracy (2 points) Submission To submit your assignment: 1. Select the Content tab then look for the name of the assignment. Don't forget to look in any Folders or Modules that appear on the page. 2. Select the assignment name. A Details and Information page opens. 3. Select the View assessment button. An Assignment Content page opens. 4. Scroll to the Submission field and record your answers. You can also cut and paste directly from a Microsoft document or drop a file into the field. 5. Click the Submit button to save your work for marking then again to confirm. 6. A confirmation message appears. Copy the confirmation number from the screen or select the Download button to save it as a file (Optional)
Step by Step Solution
There are 3 Steps involved in it
1 Expert Approved Answer
Step: 1 Unlock
Question Has Been Solved by an Expert!
Get step-by-step solutions from verified subject matter experts
Step: 2 Unlock
Step: 3 Unlock
Students Have Also Explored These Related Accounting Questions!