

Question: PERT Probabilistic Analysis You are assigned as the new project manager for Sensor Design Project. You are in the processes of developing and analyzing the
PERT Probabilistic Analysis You are assigned as the new project manager for Sensor Design Project. You are in the processes of developing and analyzing the project’s schedule. Based on the WBS and internal interviews, you outlined the tasks, linkages, and duration range for each task as shown below.
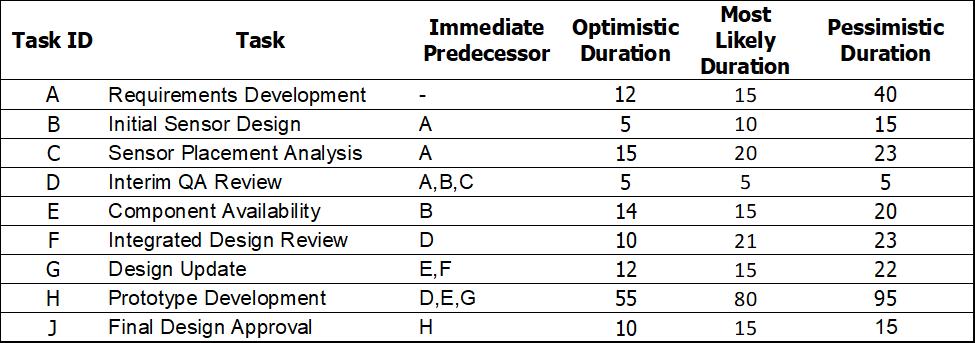
Please answer questions a), b) and c) using this data and the PERT (probabilistic) method
- Identify the critical path and calculate the mean and standard deviation of the project completion time. Please show your work by inserting Excel analysis
- Using Normal Distribution Table (included at the end of this Midterm document), what is the probability that the project is completed within 181 days? Please show both the Z value and probability
- What is the 85th percentile for the project duration? You can calculate the duration using either normal distribution method or Excel functionality
Task ID A BU Task Requirements Development Initial Sensor Design Sensor Placement Analysis Interim QA Review C D E Component Availability F Integrated Design Review G Design Update H Prototype Development Final Design Approval J Immediate Optimistic Predecessor Duration - A A A,B,C BDED E,F D,E,G H 25554 12 15 14 10 12 55 10 Most Likely Duration 15 10 20 5 15 21 15 80 15 Pessimistic Duration 40 15 23 5 20 23 22 95 15
Step by Step Solution
There are 3 Steps involved in it
Answer To calculate the mean and standard deviation of the project completion time using the PERT method well first determine the expected duration TE ... View full answer

Get step-by-step solutions from verified subject matter experts