

Question: PetMed Express case updated This is an individual assignment but you may coordinate with members of your group Review the PetMed Express at the end
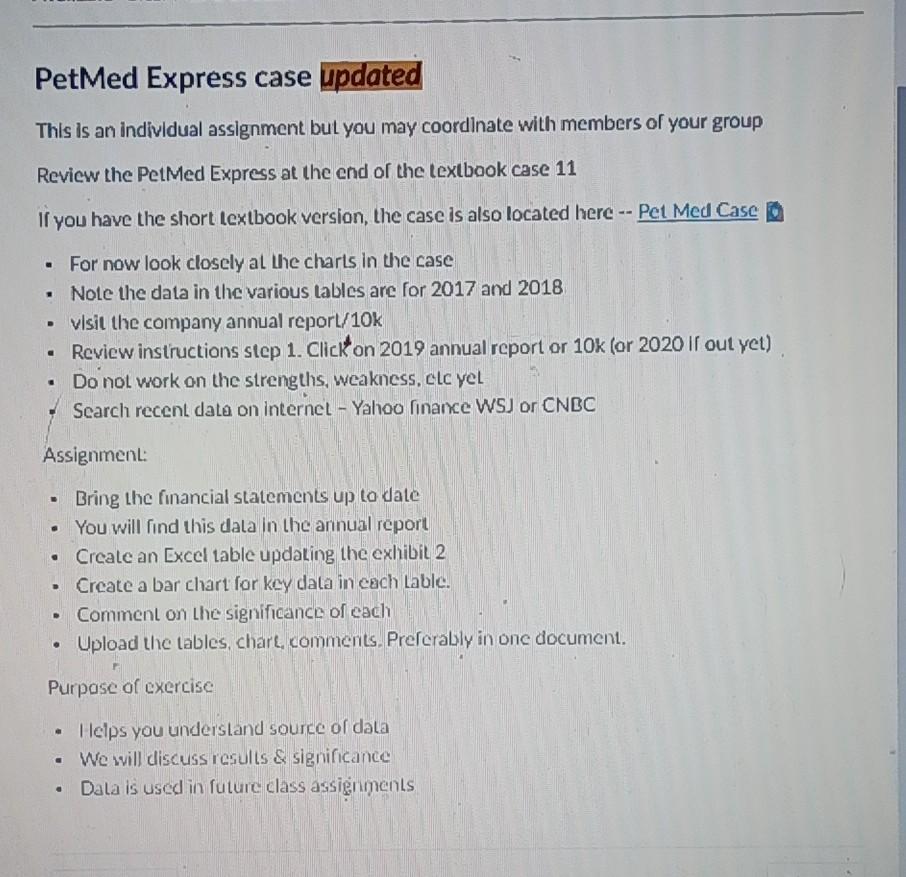
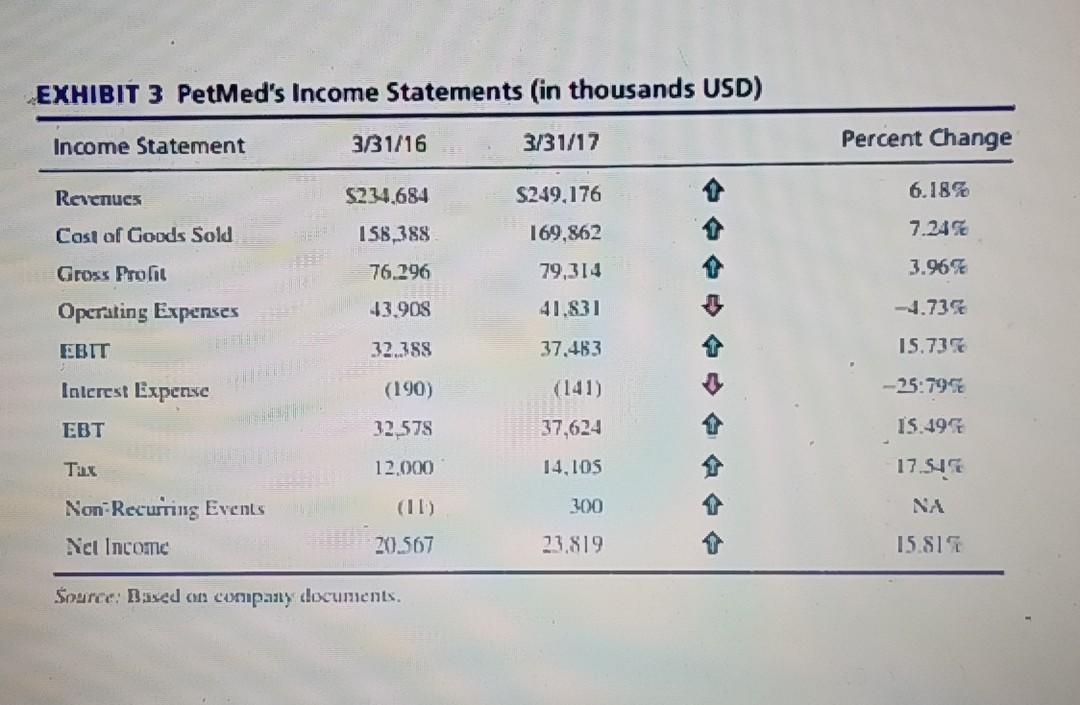
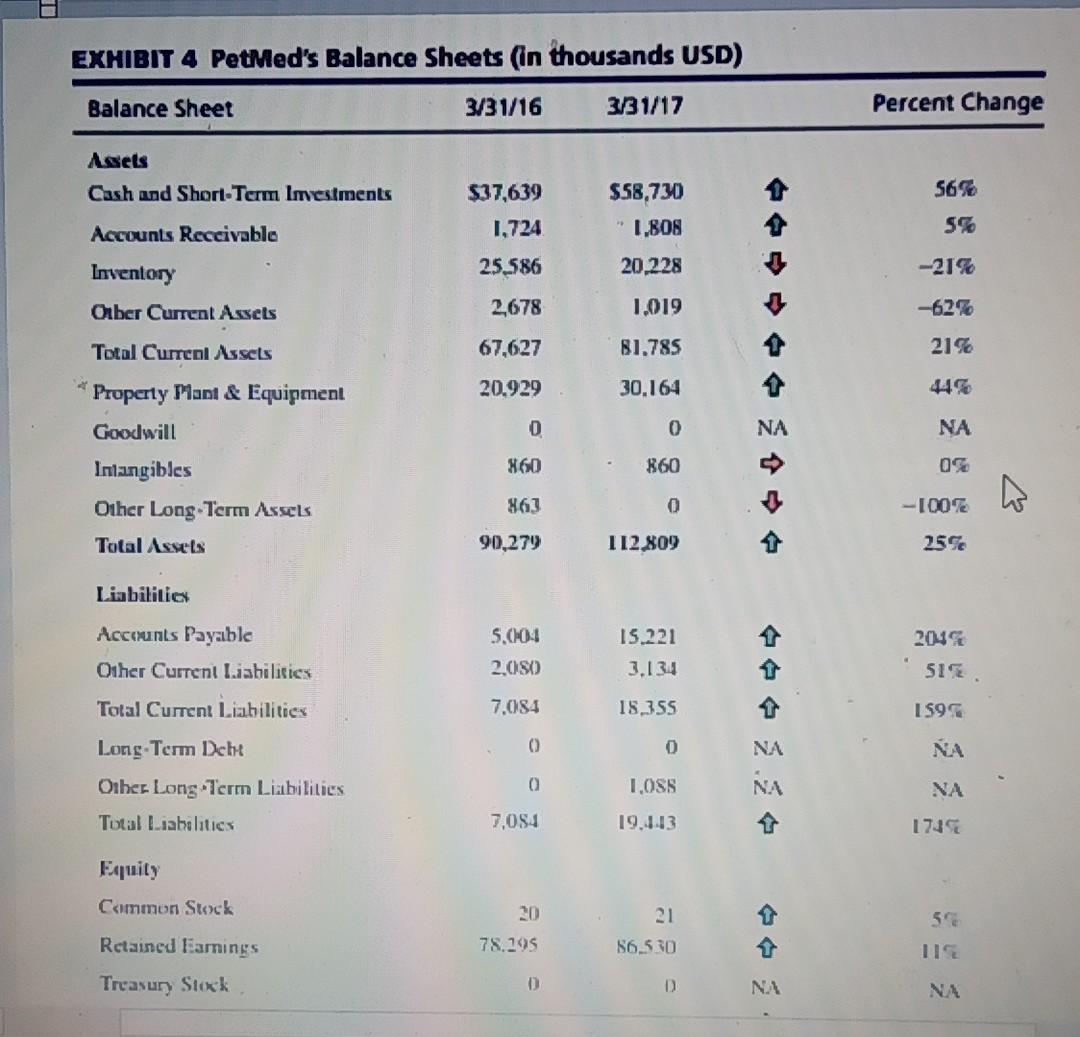
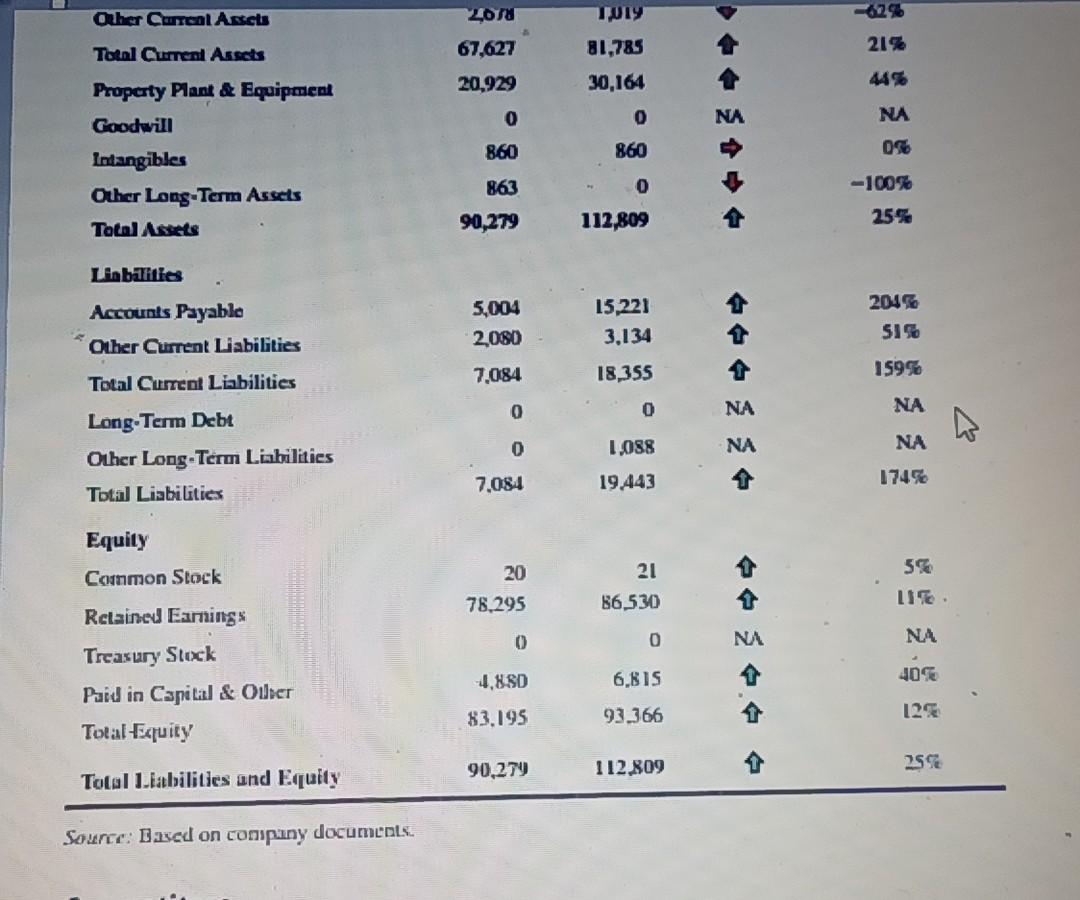
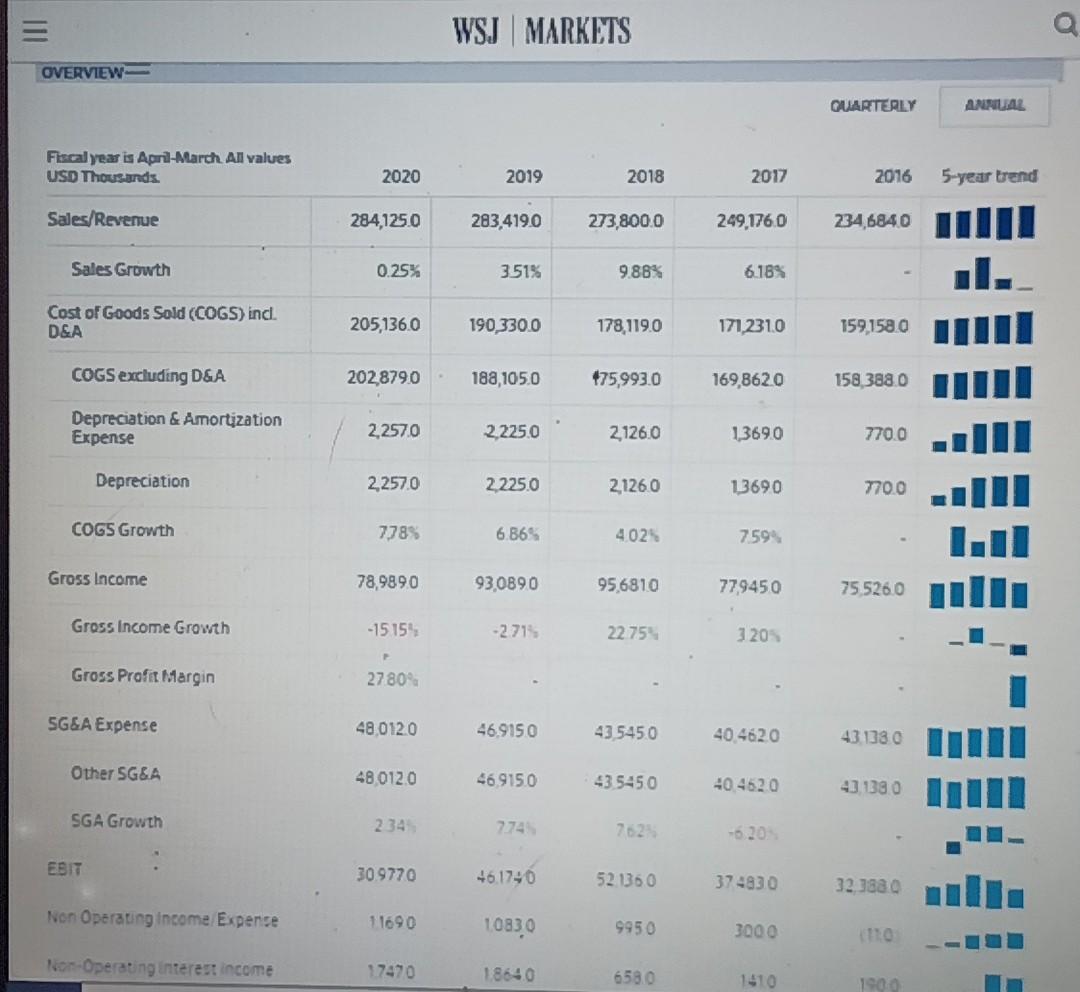
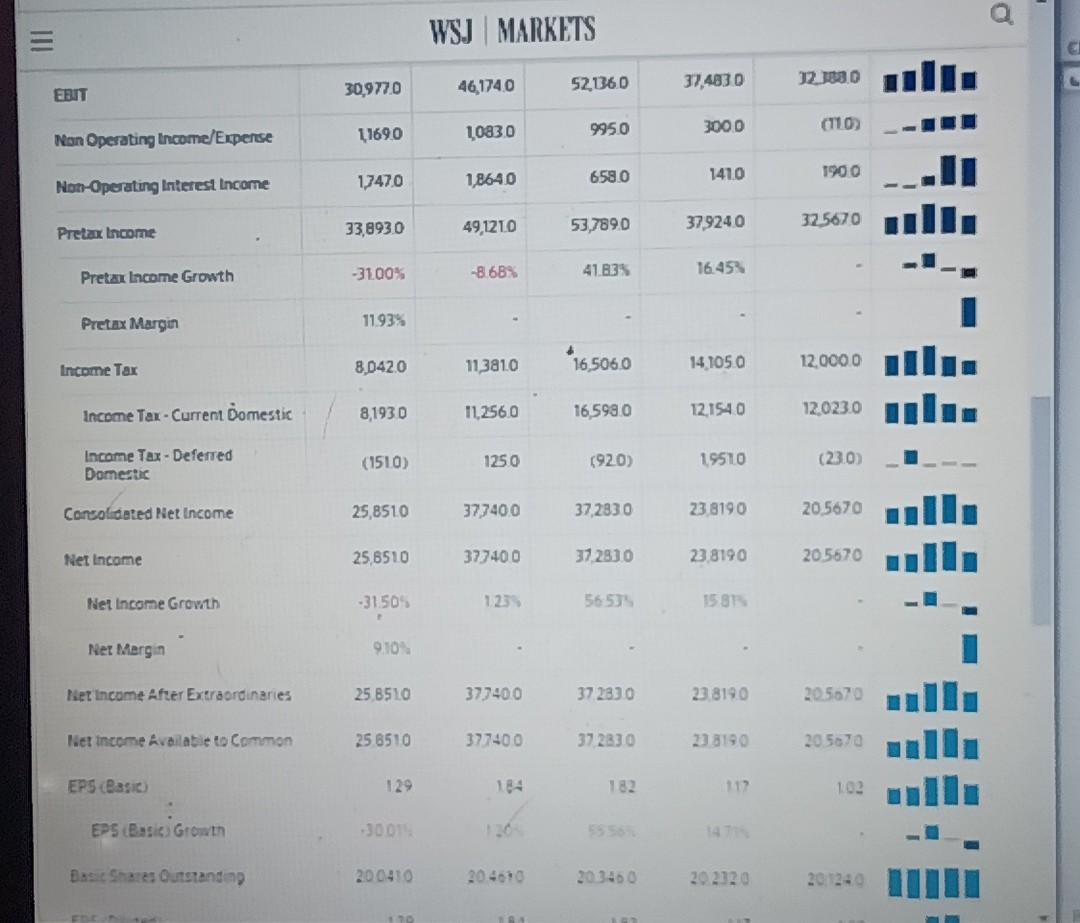
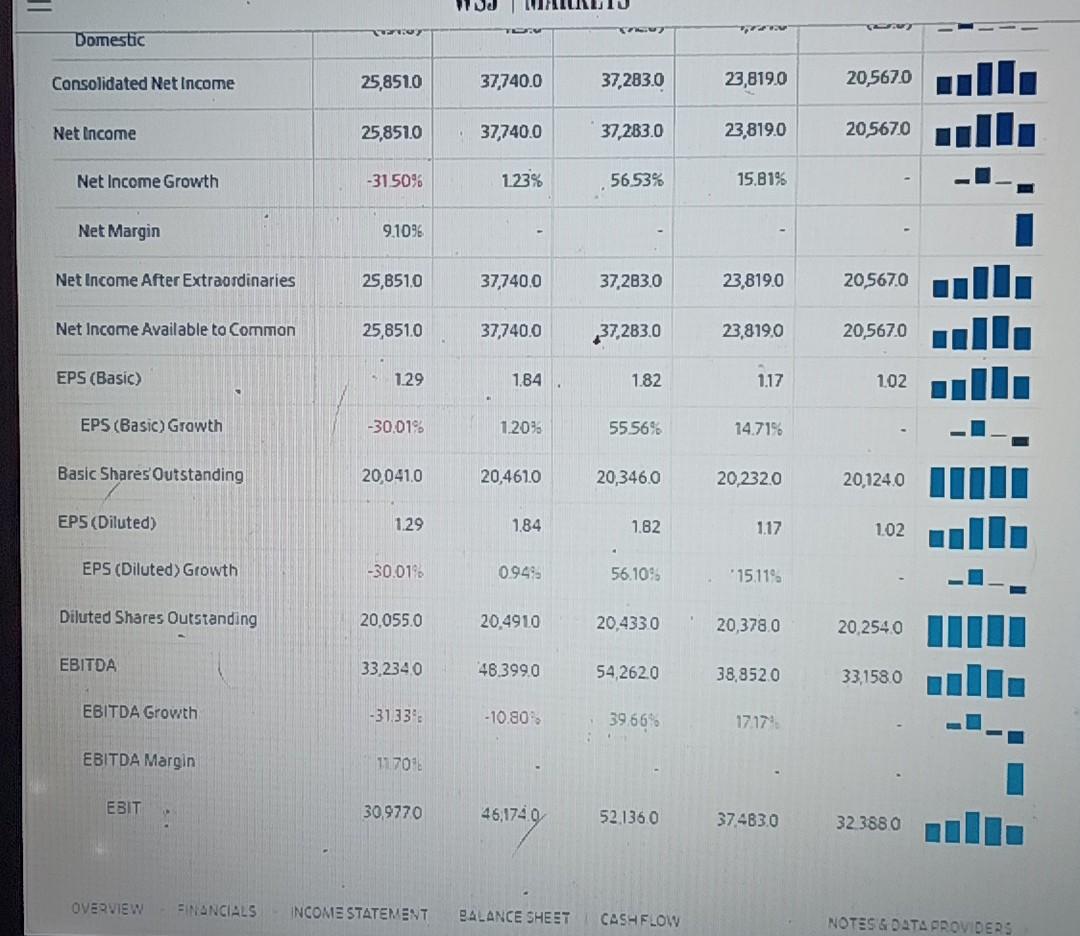
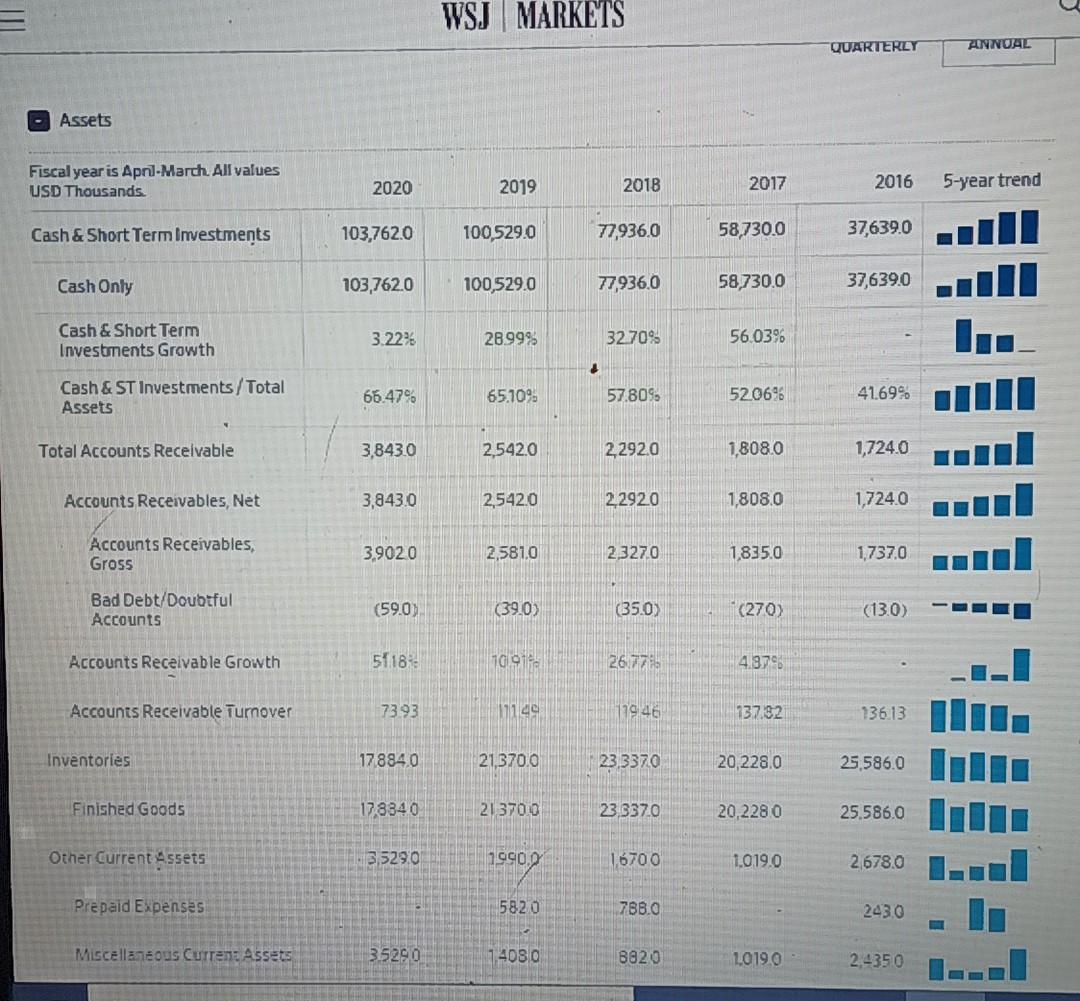
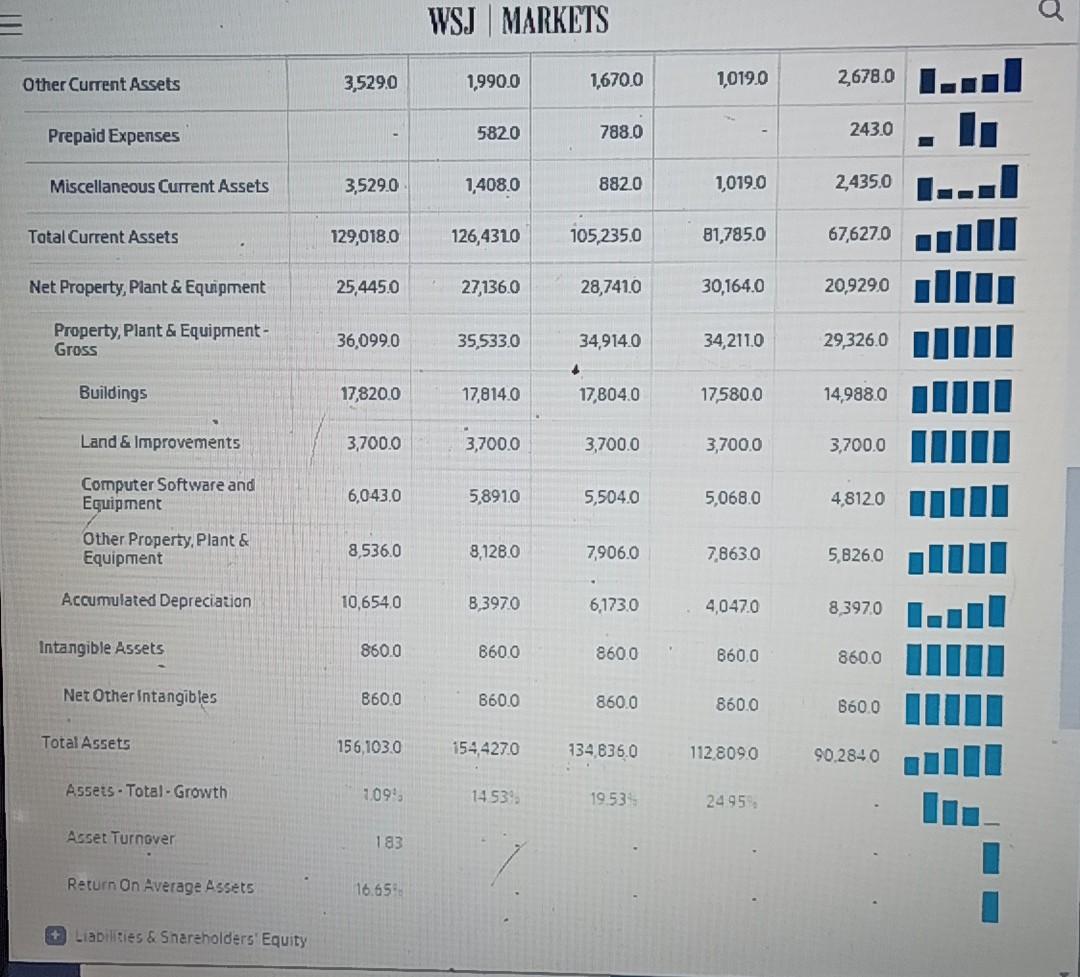
PetMed Express case updated This is an individual assignment but you may coordinate with members of your group Review the PetMed Express at the end of the textbook case 11 If you have the short textbook version, the case is also located here -- Pet Med Case . For now look closely at the charts in the case Note the data in the various tables are for 2017 and 2018 visit the company annual report/10k Review instructions step 1. Click on 2019 annual report or 10% (or 2020 If out yet) Do not work on the strengths, weakness, clc yel Search recent data on internet - Yahoo finance WSJ or CNBC . Assignment . Bring the financial statements up to date You will find this data in the annual report Create an Excel table updating the exhibit 2 Create a bar chart for key data in each Lable. Comment on the significance of each Upload the tables, chart, comments. Preferably in one document, Purpose of exercise Helps you understand source of dala We will discuss results & significance Dala is used in future class assignments . EXHIBIT 3 PetMed's Income Statements (in thousands USD) Income Statement 3/31/16 3/31/17 Percent Change Revenues $234,684 S249,176 6.18% Cast of Goods Sold 158,388 169,862 7.24% 76.296 79,314 3.96% Gross Profit Operating Expenses 43.908 41.831 -4.735 EBIT 32.388 37,483 15.73 lalcrest Expense (190) (141) -25:795 EBT 32,575 37,624 IS 195 TEC 12.000 14,105 17.94 300 NA Non-Recurring Events Net Income 201.567 23,819 15.SI Source: Based on company documents EXHIBIT 4 PetMed's Balance Sheets (in thousands USD) Balance Sheet 3/31/16 3/31/17 Percent Change Asets Cash and Short-Term Investments 56% $37,639 1,724 $58,730 1,808 Accounts Receivable 5% Inventory 25.586 20.228 -21% Olber Current Assets 2,678 1.019 -62% Total Current Assets 67,627 81.785 21% 20.929 30.164 44% Property Plant & Equipment Goodwill Intangibles 0 0 NA NA 860 860 05 863 0 -100% Other Long Term Assels Total Assets 90,279 112.809 25% Liabilities 5,004 15.221 3.134 2044 513 2.050 Accounts Payable Other Current Liabilities Total Current Liabilitiek Long Term Deht 7.084 18.355 ISI 0 0 NA NA 0 1.OSS NA NA Oiher Long Term Liabilities Total Liabalitics 7,054 19.1.13 1745 Equity Cammon Stock 56 21 86.530 Retained larnings 78.195 Treasury Stock D D NA NA Olher Carreal Assets 207 21% Total Current Assets 67,627 20.929 81,783 30,164 44% 0 0 NA NA Property Plant & Equipment Goodwill Intangibles Other Long Term Assets 860 860 056 863 0 -100% 90,279 Total Assets 112,809 25% Liabilities Accounts Payable Other Current Liabilities 5,004 2,080 15,221 3.134 2045 SIS 7.084 Total Current Liabilities 18,355 1999 0 0 NA NA 0 1.088 NA NA Long Term Debt Other Long-Term Liabilities Total Liabilities 7.084 19.443 1745 Equity 56 Common Stock 20 78,295 21 86.530 LIT Retained Earnings 0 0 NA NA Treasury Stock 4.880 6,81S 40% Paid in Capital & Other 83.195 93.366 12 Total Equity 90.279 112.809 255 Total Liabilities and Equity Source: Based on company documents. WSJ MARKETS OVERVIEW QUARTERLY ANNUAL Fiscal year is April March All values USD Thousands. 2020 2019 2018 2017 2016 5 year trend Sales/Revenue 284,125.0 283,4190 273,800.0 249,176.0 234,6840 Sales Growth 0.25% 351% 9.88% 6.18% Cost of Goods Sold (COGS) ind. D&A 205,136.0 190,330.0 178,119.0 171.2310 159,158.0 COGS excluding D&A 202,8790 188,1050 175,993.0 169,8620 158.388.0 Depreciation & Amortization Expense 2,2570 2.225.0 2,126.0 1,369.0 7700 Depreciation 2,2570 2.225.0 2,1260 13690 770.0 COGS Growth 7789 6.365 4025 7599 Gross income 78,9890 93,0890 95.6810 77,9450 75 526,0 Gross Income Growth -15159 -271 2275 320 Gross Profit Margin 2780 SG&A Expense 48,012.0 46.9150 43 5450 40.4620 43.1380 Other SG&A 480120 46.9150 435450 40.4620 43. 1380 SGA Growth 234 774 762 EBIT 30.9770 46.1740 52 1360 374830 32.3880 Non Operating income Expense 11690 10830 9950 3000 Non-Operating interest income 17470 18640 658.0 1410 1900 WSJ MARKETS 30,9770 46,1740 52,1360 37,4830 12.133.0 EBIT 11690 1,0830 9950 3000 (110) Non Operating Income/Expense 6580 1410 1900 17470 1,8640 Non-Operating Interest Income 33,893.0 49,1210 Pretax Income 53,7890 379240 32 5670 -3100% Preta Income Growth -8.68% 41.835 16.455 Pretax Margin 11.93% 8,0420 11,3810 Income Tax 16,506.0 14 1050 12.000.0 8,1930 Income Tax - Current Domestic 11.2560 16,599.0 121540 12.0230 Income Tax-Deferred Domestic (1510) 1250 (920) 19510 (23.0) Consolidated Net Income 25,8510 377400 37,2830 23 8190 205670 Net Income 25,6510 377400 372830 23.8190 20.5670 Net Income Growth -31.505 123 56 53% 1581 Ner Margin 9104 Net Income After Extraordinaries 25 8510 377400 372830 23 8190 205670 liet Income Available to Common 25 6510 377400 372830 28190 205070 EPS (Basic 129 184 112 102 EPS Basic Growth -3001 14 Basit Shares Outstanding 200410 204670 202320 warto TO Domestic Consolidated Net Income 25,851.0 37,740.0 37,283.0 23,819.0 20,5670 Net Income 25,851.0 37,740.0 37,283.0 23,819.0 20,5670 Net Income Growth -31.50% 123% 56.53% 15,81% Net Margin 9.1096 Net Income After Extraordinaries 25,851.0 37,740.0 37,283,0 23,819.0 20,567.0 Net Income Available to common 25,851.0 37,740.0 37,2B3.0 23,819.0 20,567.0 EPS (Basic) 1.29 1.84 1.82 1.17 1.02 EPS (Basic) Growth -30.01% 1.20% 55.56% 14.71% Basic Shares Outstanding 20.041.0 20,4610 20,346,0 20,2320 20,124.0 EPS (Diluted) 1.29 1.84 1.82 1.17 1.02 EPS (Diluted) Growth -30.0198 0949 56.10% 15.11% Diluted Shares Outstanding 20.055.0 20,4910 20.4330 20,378.0 20,2540 EBITDA 33,2340 48.399.0 54,2620 38,8520 33,1580 EBITDA Growth -31.333 -10.80 39.66% 17.17 EBITDA Margin 17701 EBIT 30,9770 46,1740 52.1360 37.483.0 32.3880 OVERVIEW FINANCIALS INCOME STATEMENT BALANCE SHEET CASHFLOW NOTES G DATA PROVIDERS WSJ MARKETS QUARTERLY ANNUAL - Assets Fiscal year is Aprl-Marth. All values USD Thousands. 2020 2019 2018 2017 2016 5-year trend Cash & Short Term Investments 103,762.0 100,529.0 77,9360 58,730.0 37,639.0 Cash Only 103,762.0 100,529.0 77936.0 58,730.0 37,6390 Cash & Short Term Investments Growth 3.22% 28999 32.70% 56.03% Cash & ST Investments/Total Assets 66.47% 65.109 57.809 5206% 41.69% Total Accounts Receivable 3,843.0 2.542.0 2,2920 1,8080 1,724.0 Accounts Receivables, Net 3,843.0 2,542.0 22920 1,808.0 1,7240 Accounts Receivables, Gross 3,9020 2,581,0 2,3270 1835.0 1,737.0 Bad Debt/Doubtful Accounts (59.0) (39.0) (35.0) (270) (13.0) Accounts Receivable Growth 51183 10 91 26,77% 4.97% Accounts Receivable Turnover 7393 11140 119.46 137.92 136.13 Inventories 178840 21,370.0 23,3370 20,228.0 25,586.0 Finished Goods 17,8840 213700 23,3370 20,2280 25.586.0 Other Current Assets 3,5290 19900 16700 1.019,0 2678.0 Prepaid Expenses 582 0 788.0 2430 Miscellaneous Current Assets 35290 14080 8820 1,0199 2.4350 WSJ MARKETS Other Current Assets 3,529.0 1,990.0 1.670.0 1,019.0 2,678.0 Prepaid Expenses 5820 788.0 243.0 Miscellaneous Current Assets 3,529.0 1,408.0 882.0 1,019.0 2,435.0 Total Current Assets 129,018.0 126,4310 105,235.0 81,785.0 67,627.0 Net Property, Plant & Equipment 25,445.0 27,136.0 28,741.0 30,164.0 20,9290 Property, Plant & Equipment- Gross 36,099.0 35,533.0 34,914.0 34,211.0 29,326.0 + Buildings 17,820.0 17,814.0 17,804.0 17580.0 14,988.0 Land & Improvements 3,700.0 3,700.0 3,700.0 3,700.0 3,700.0 Computer Software and Equipment 6,043.0 5,891,0 5,504.0 5,068.0 4,8120 Other Property, Plant & Equipment 8,536.0 8,1280 7,906.0 7,863.0 5,826,0 Accumulated Depreciation 10,654.0 8,3970 6,173.0 4,047.0 8 3970 Intangible Assets 8600 8600 8600 8600 8600 Net Other Intangibles 8600 8600 860.0 860.0 860.0 Total Assets 156,103,0 1544270 134 135.0 112.8090 90.2840 Assets - Total - Growth 109 1453 19.53 2495 Asset Turnover 183 Return On Average Assets 16.65 Liabilities & Shareholders' Equity PetMed Express case updated This is an individual assignment but you may coordinate with members of your group Review the PetMed Express at the end of the textbook case 11 If you have the short textbook version, the case is also located here -- Pet Med Case . For now look closely at the charts in the case Note the data in the various tables are for 2017 and 2018 visit the company annual report/10k Review instructions step 1. Click on 2019 annual report or 10% (or 2020 If out yet) Do not work on the strengths, weakness, clc yel Search recent data on internet - Yahoo finance WSJ or CNBC . Assignment . Bring the financial statements up to date You will find this data in the annual report Create an Excel table updating the exhibit 2 Create a bar chart for key data in each Lable. Comment on the significance of each Upload the tables, chart, comments. Preferably in one document, Purpose of exercise Helps you understand source of dala We will discuss results & significance Dala is used in future class assignments . EXHIBIT 3 PetMed's Income Statements (in thousands USD) Income Statement 3/31/16 3/31/17 Percent Change Revenues $234,684 S249,176 6.18% Cast of Goods Sold 158,388 169,862 7.24% 76.296 79,314 3.96% Gross Profit Operating Expenses 43.908 41.831 -4.735 EBIT 32.388 37,483 15.73 lalcrest Expense (190) (141) -25:795 EBT 32,575 37,624 IS 195 TEC 12.000 14,105 17.94 300 NA Non-Recurring Events Net Income 201.567 23,819 15.SI Source: Based on company documents EXHIBIT 4 PetMed's Balance Sheets (in thousands USD) Balance Sheet 3/31/16 3/31/17 Percent Change Asets Cash and Short-Term Investments 56% $37,639 1,724 $58,730 1,808 Accounts Receivable 5% Inventory 25.586 20.228 -21% Olber Current Assets 2,678 1.019 -62% Total Current Assets 67,627 81.785 21% 20.929 30.164 44% Property Plant & Equipment Goodwill Intangibles 0 0 NA NA 860 860 05 863 0 -100% Other Long Term Assels Total Assets 90,279 112.809 25% Liabilities 5,004 15.221 3.134 2044 513 2.050 Accounts Payable Other Current Liabilities Total Current Liabilitiek Long Term Deht 7.084 18.355 ISI 0 0 NA NA 0 1.OSS NA NA Oiher Long Term Liabilities Total Liabalitics 7,054 19.1.13 1745 Equity Cammon Stock 56 21 86.530 Retained larnings 78.195 Treasury Stock D D NA NA Olher Carreal Assets 207 21% Total Current Assets 67,627 20.929 81,783 30,164 44% 0 0 NA NA Property Plant & Equipment Goodwill Intangibles Other Long Term Assets 860 860 056 863 0 -100% 90,279 Total Assets 112,809 25% Liabilities Accounts Payable Other Current Liabilities 5,004 2,080 15,221 3.134 2045 SIS 7.084 Total Current Liabilities 18,355 1999 0 0 NA NA 0 1.088 NA NA Long Term Debt Other Long-Term Liabilities Total Liabilities 7.084 19.443 1745 Equity 56 Common Stock 20 78,295 21 86.530 LIT Retained Earnings 0 0 NA NA Treasury Stock 4.880 6,81S 40% Paid in Capital & Other 83.195 93.366 12 Total Equity 90.279 112.809 255 Total Liabilities and Equity Source: Based on company documents. WSJ MARKETS OVERVIEW QUARTERLY ANNUAL Fiscal year is April March All values USD Thousands. 2020 2019 2018 2017 2016 5 year trend Sales/Revenue 284,125.0 283,4190 273,800.0 249,176.0 234,6840 Sales Growth 0.25% 351% 9.88% 6.18% Cost of Goods Sold (COGS) ind. D&A 205,136.0 190,330.0 178,119.0 171.2310 159,158.0 COGS excluding D&A 202,8790 188,1050 175,993.0 169,8620 158.388.0 Depreciation & Amortization Expense 2,2570 2.225.0 2,126.0 1,369.0 7700 Depreciation 2,2570 2.225.0 2,1260 13690 770.0 COGS Growth 7789 6.365 4025 7599 Gross income 78,9890 93,0890 95.6810 77,9450 75 526,0 Gross Income Growth -15159 -271 2275 320 Gross Profit Margin 2780 SG&A Expense 48,012.0 46.9150 43 5450 40.4620 43.1380 Other SG&A 480120 46.9150 435450 40.4620 43. 1380 SGA Growth 234 774 762 EBIT 30.9770 46.1740 52 1360 374830 32.3880 Non Operating income Expense 11690 10830 9950 3000 Non-Operating interest income 17470 18640 658.0 1410 1900 WSJ MARKETS 30,9770 46,1740 52,1360 37,4830 12.133.0 EBIT 11690 1,0830 9950 3000 (110) Non Operating Income/Expense 6580 1410 1900 17470 1,8640 Non-Operating Interest Income 33,893.0 49,1210 Pretax Income 53,7890 379240 32 5670 -3100% Preta Income Growth -8.68% 41.835 16.455 Pretax Margin 11.93% 8,0420 11,3810 Income Tax 16,506.0 14 1050 12.000.0 8,1930 Income Tax - Current Domestic 11.2560 16,599.0 121540 12.0230 Income Tax-Deferred Domestic (1510) 1250 (920) 19510 (23.0) Consolidated Net Income 25,8510 377400 37,2830 23 8190 205670 Net Income 25,6510 377400 372830 23.8190 20.5670 Net Income Growth -31.505 123 56 53% 1581 Ner Margin 9104 Net Income After Extraordinaries 25 8510 377400 372830 23 8190 205670 liet Income Available to Common 25 6510 377400 372830 28190 205070 EPS (Basic 129 184 112 102 EPS Basic Growth -3001 14 Basit Shares Outstanding 200410 204670 202320 warto TO Domestic Consolidated Net Income 25,851.0 37,740.0 37,283.0 23,819.0 20,5670 Net Income 25,851.0 37,740.0 37,283.0 23,819.0 20,5670 Net Income Growth -31.50% 123% 56.53% 15,81% Net Margin 9.1096 Net Income After Extraordinaries 25,851.0 37,740.0 37,283,0 23,819.0 20,567.0 Net Income Available to common 25,851.0 37,740.0 37,2B3.0 23,819.0 20,567.0 EPS (Basic) 1.29 1.84 1.82 1.17 1.02 EPS (Basic) Growth -30.01% 1.20% 55.56% 14.71% Basic Shares Outstanding 20.041.0 20,4610 20,346,0 20,2320 20,124.0 EPS (Diluted) 1.29 1.84 1.82 1.17 1.02 EPS (Diluted) Growth -30.0198 0949 56.10% 15.11% Diluted Shares Outstanding 20.055.0 20,4910 20.4330 20,378.0 20,2540 EBITDA 33,2340 48.399.0 54,2620 38,8520 33,1580 EBITDA Growth -31.333 -10.80 39.66% 17.17 EBITDA Margin 17701 EBIT 30,9770 46,1740 52.1360 37.483.0 32.3880 OVERVIEW FINANCIALS INCOME STATEMENT BALANCE SHEET CASHFLOW NOTES G DATA PROVIDERS WSJ MARKETS QUARTERLY ANNUAL - Assets Fiscal year is Aprl-Marth. All values USD Thousands. 2020 2019 2018 2017 2016 5-year trend Cash & Short Term Investments 103,762.0 100,529.0 77,9360 58,730.0 37,639.0 Cash Only 103,762.0 100,529.0 77936.0 58,730.0 37,6390 Cash & Short Term Investments Growth 3.22% 28999 32.70% 56.03% Cash & ST Investments/Total Assets 66.47% 65.109 57.809 5206% 41.69% Total Accounts Receivable 3,843.0 2.542.0 2,2920 1,8080 1,724.0 Accounts Receivables, Net 3,843.0 2,542.0 22920 1,808.0 1,7240 Accounts Receivables, Gross 3,9020 2,581,0 2,3270 1835.0 1,737.0 Bad Debt/Doubtful Accounts (59.0) (39.0) (35.0) (270) (13.0) Accounts Receivable Growth 51183 10 91 26,77% 4.97% Accounts Receivable Turnover 7393 11140 119.46 137.92 136.13 Inventories 178840 21,370.0 23,3370 20,228.0 25,586.0 Finished Goods 17,8840 213700 23,3370 20,2280 25.586.0 Other Current Assets 3,5290 19900 16700 1.019,0 2678.0 Prepaid Expenses 582 0 788.0 2430 Miscellaneous Current Assets 35290 14080 8820 1,0199 2.4350 WSJ MARKETS Other Current Assets 3,529.0 1,990.0 1.670.0 1,019.0 2,678.0 Prepaid Expenses 5820 788.0 243.0 Miscellaneous Current Assets 3,529.0 1,408.0 882.0 1,019.0 2,435.0 Total Current Assets 129,018.0 126,4310 105,235.0 81,785.0 67,627.0 Net Property, Plant & Equipment 25,445.0 27,136.0 28,741.0 30,164.0 20,9290 Property, Plant & Equipment- Gross 36,099.0 35,533.0 34,914.0 34,211.0 29,326.0 + Buildings 17,820.0 17,814.0 17,804.0 17580.0 14,988.0 Land & Improvements 3,700.0 3,700.0 3,700.0 3,700.0 3,700.0 Computer Software and Equipment 6,043.0 5,891,0 5,504.0 5,068.0 4,8120 Other Property, Plant & Equipment 8,536.0 8,1280 7,906.0 7,863.0 5,826,0 Accumulated Depreciation 10,654.0 8,3970 6,173.0 4,047.0 8 3970 Intangible Assets 8600 8600 8600 8600 8600 Net Other Intangibles 8600 8600 860.0 860.0 860.0 Total Assets 156,103,0 1544270 134 135.0 112.8090 90.2840 Assets - Total - Growth 109 1453 19.53 2495 Asset Turnover 183 Return On Average Assets 16.65 Liabilities & Shareholders' Equity
Step by Step Solution
There are 3 Steps involved in it

Get step-by-step solutions from verified subject matter experts