

Question: PHASE 3 ( 3 0 % ) Phase 2 program, which implements k - means algorithm, produces two clusters - one containing benign cells (
PHASE
Phase program, which implements kmeans algorithm, produces two clusters one containing benign
cells predicted class and the other one that contains malign cells predicted class But there are
chances that a malign cell is clustered into a benign cluster and vice versa.
In phase you will analyze the quality of the clustering. To check how well your clustering worked, you
will calculate the error rate for your clusters. Assume that the column "Class" of the initial data set
contains correct clustering of the data points.
INSTRUCTIONS
There are two parts in phase :
Write a code to calculate the individual and total error rates of the predicted clusters.
Prepare and submit final report
a Write code to calculate the individual and total error rates of the predicted clusters
Your phase program will calculate the error rates based on two arguments:
The predicted clusters, calculated by your phase program,
The correct clusters, specified by the column "Class" of the initial data set.
Let's have a look at the example of the cluster assignment with first data points, listed on page
Column "Class" represents the correct clusters and column "PredictedClass" represents the
clusters calculated by the means algorithm.Marked data points represent the errors of the kmeans clustering:
Yellow data points are predicted as class malign cells while the correct class is
benign cells
Gray data points are predicted as class benign cells while the correct class is
malign cells
Let's define the following notation:
Use the following formulae to calculate and print error rates for each cluster:
erro
Total error rate more than indicates that your program swapped the predicted clusters. Your
program has to detect this situation, swap the predicted clusters by replacing with and with
in column "PredictedClass", and recalculate the error rates.
b Prepare final report that incorporates all the results and your conclusions for phases to
SAMPLE OUTPUT
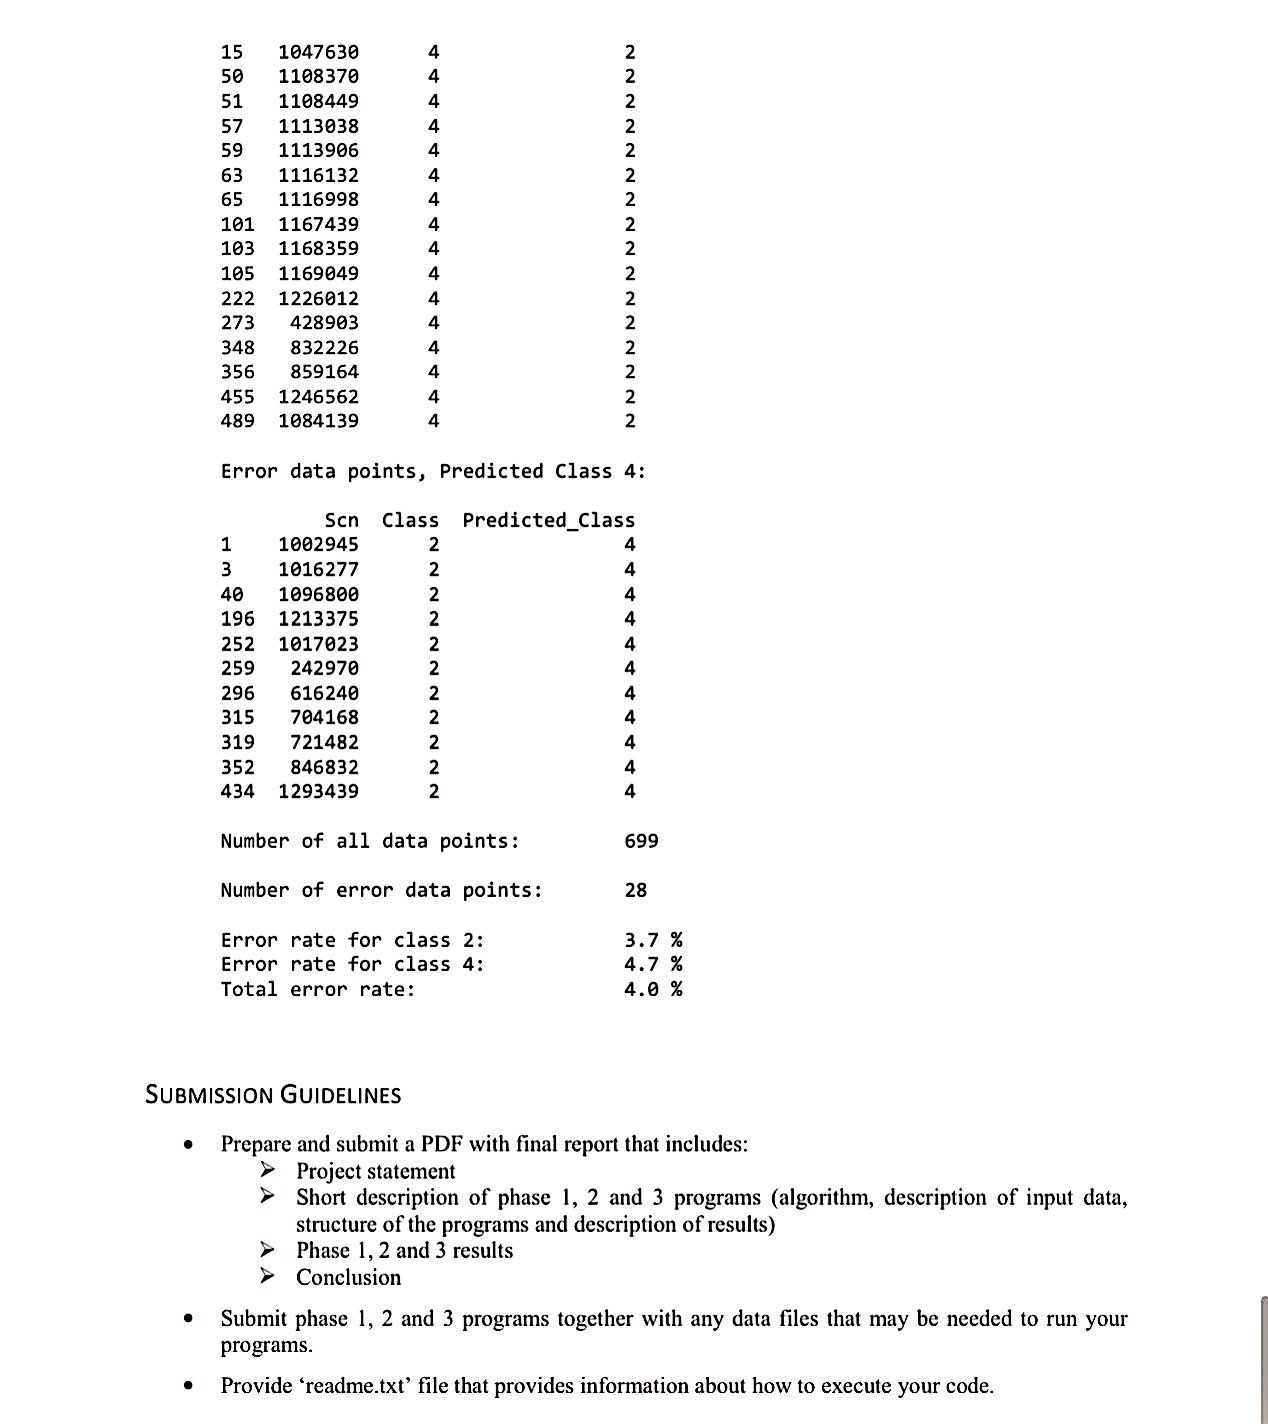
This is the output in case the clusters are swapped and the program swapped the predicted class.Error data points, Predicted Class :
Number of all data points:
Number of error data points:
Error rate for class :
Error rate for class :
Total error rate:
SUBMISSION GUIDELINES
Prepare and submit a PDF with final report that includes:
Project statement
Short description of phase and programs algorithm description of input data,
structure of the programs and description of results
Phase and results
Conclusion
Submit phase and programs together with any data files that may be needed to run your
programs.
Provide 'readme.txt file that provides information about how to execute your code.
I did phase & just need #
Step by Step Solution
There are 3 Steps involved in it
1 Expert Approved Answer
Step: 1 Unlock

Question Has Been Solved by an Expert!
Get step-by-step solutions from verified subject matter experts
Step: 2 Unlock
Step: 3 Unlock