

Question: Photographed below is part 1. Part 2: using linear regression, the number of patients Dr. Fok well see in year 11 = ? patients (round
Photographed below is part 1. 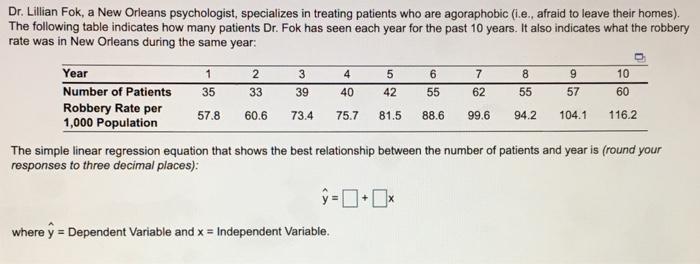
Dr. Lillian Fok, a New Orleans psychologist, specializes in treating patients who are agoraphobic (i.e., afraid to leave their homes). The following table indicates how many patients Dr. Fok has seen each year for the past 10 years. It also indicates what the robbery rate was in New Orleans during the same year: 4 5 6 10 2 33 7 62 8 55 9 57 39 40 60.6 73.4 75.7 88.6 94.2 Year 1 3 Number of Patients 35 42 55 60 Robbery Rate per 57.8 1,000 Population 81.5 99.6 104.1 The simple linear regression equation that shows the best relationship between the number of patients and year is (round your responses to three decimal places): 116.2 where y = Dependent Variable and x = Independent Variable
Part 2:
using linear regression, the number of patients Dr. Fok well see in year 11 = ? patients (round to two decimal places)
Part 3:
using linear regression, they never have patients dr Fok will see in year 12 = ? patients (round to 2 decimal places)
Part 4:
Stong or Weak relationship?
Step by Step Solution
There are 3 Steps involved in it
1 Expert Approved Answer
Step: 1 Unlock

Question Has Been Solved by an Expert!
Get step-by-step solutions from verified subject matter experts
Step: 2 Unlock
Step: 3 Unlock