

Question: Pinto.com has developed a powerful new server that would be used for corporations Internet activities. It would cost $25 million at Year 0 to buy
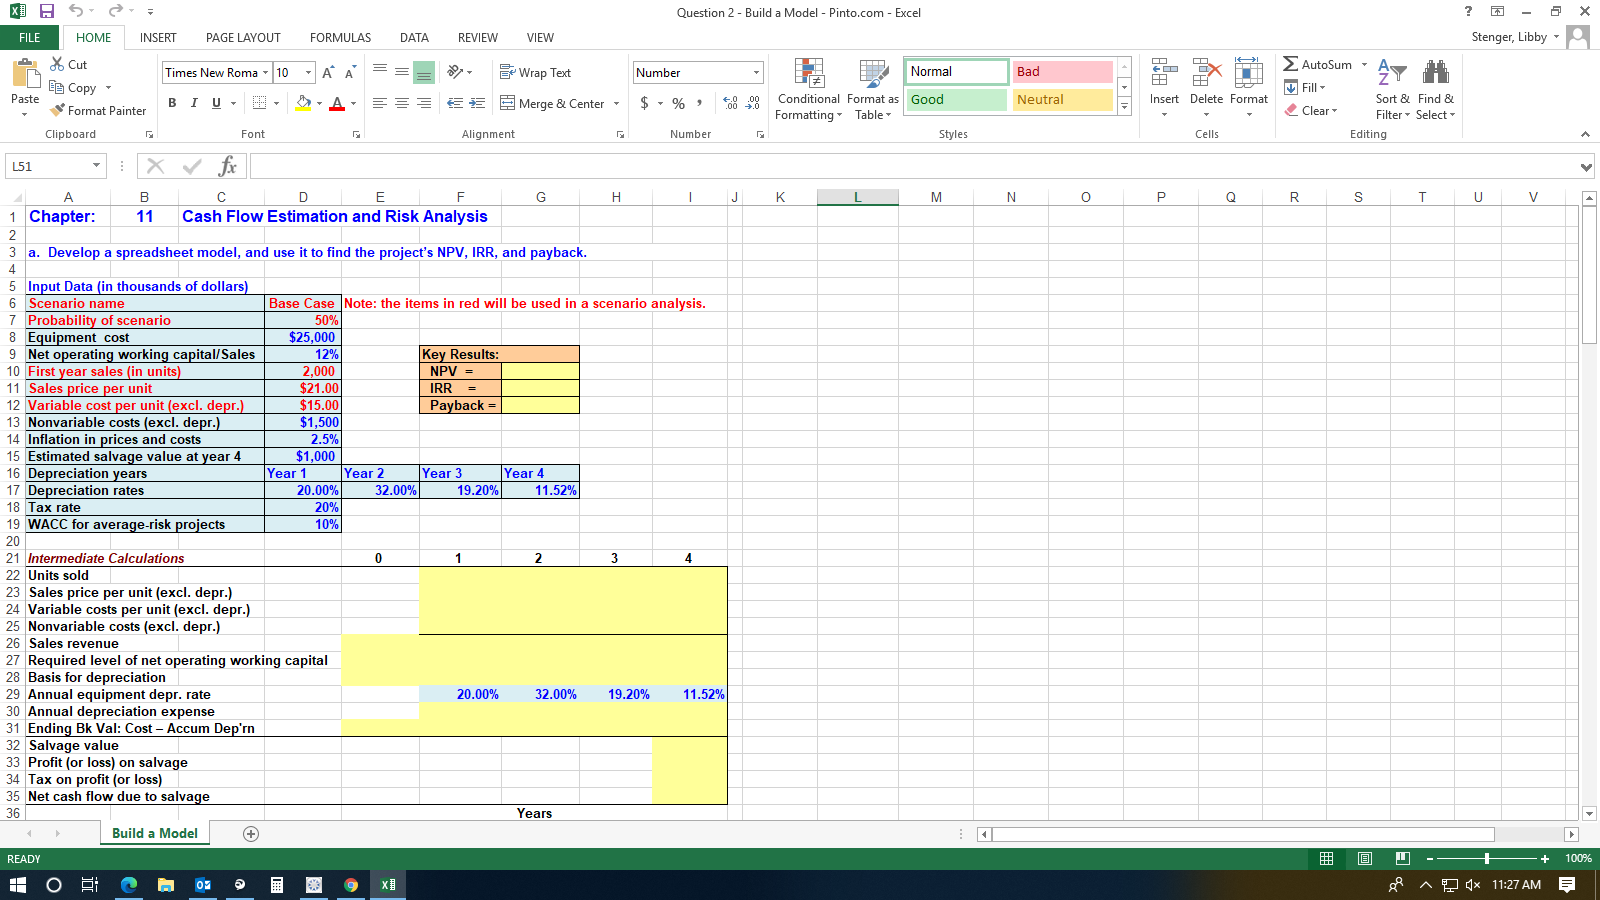
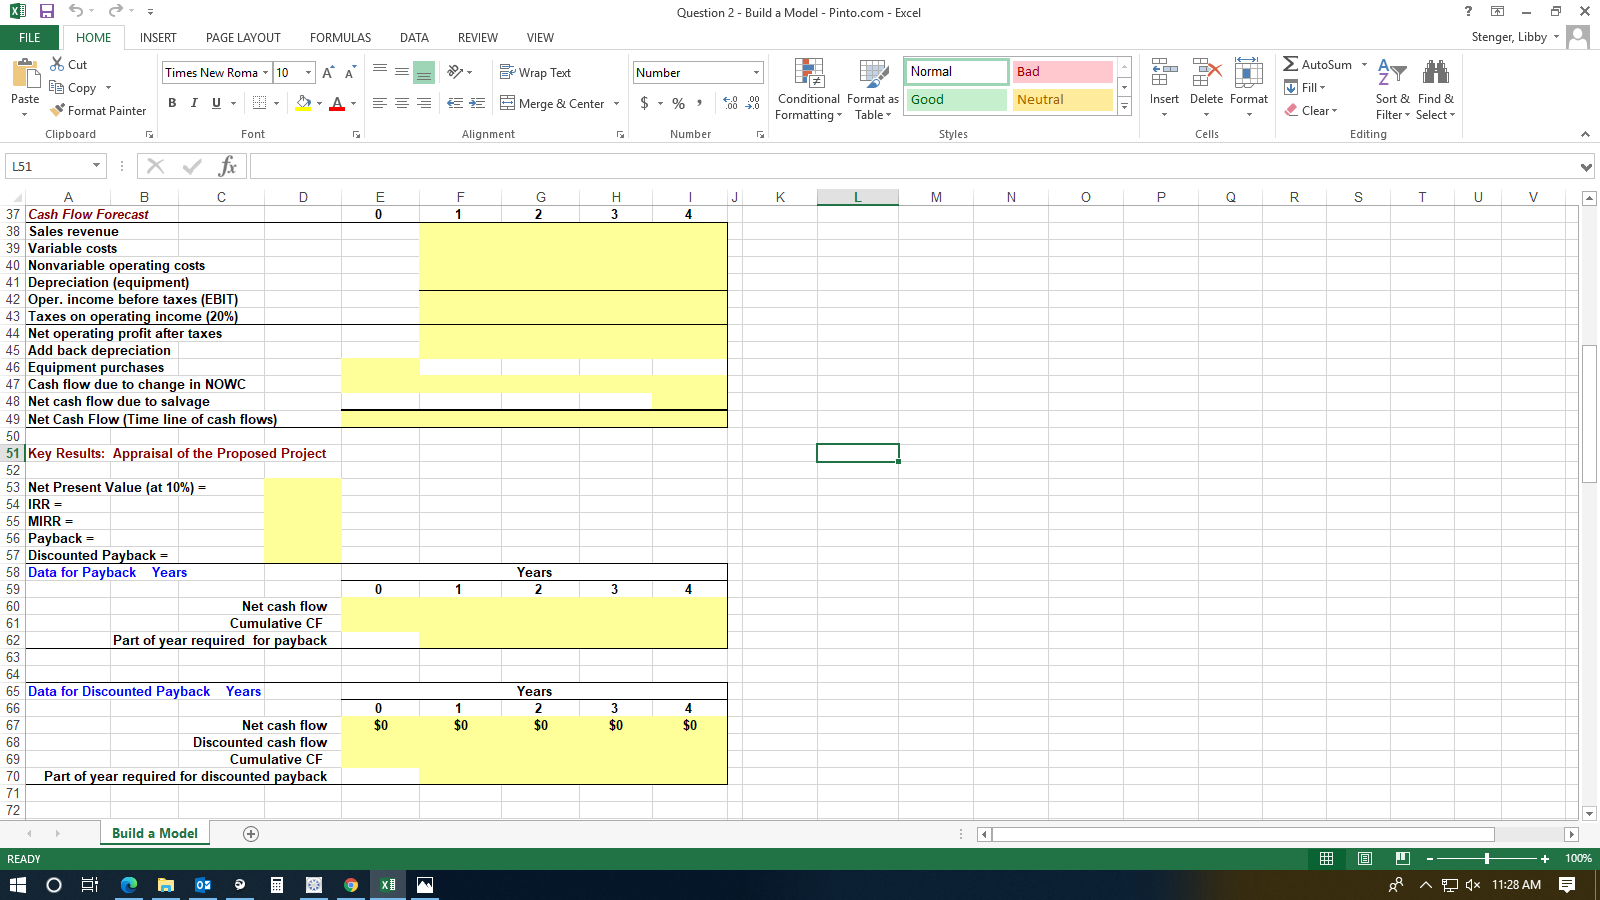
Pinto.com has developed a powerful new server that would be used for corporations Internet activities. It would cost $25 million at Year 0 to buy the equipment necessary to manufacture the server. The project would require net working capital at the beginning of each year in an amount equal to 12% of the years projected sales; for example, NWC0 = 12%(Sales1 ). The servers would sell for $21,000 per unit, and Pinto believes that variable costs would amount to $15,000 per unit. After Year 1, the sales price and variable costs will increase at the inflation rate of 2.5%. The companys nonvariable costs would be $1.5 million at Year 1 and would increase with inflation. The server project would have a life of 4 years. If the project is undertaken, it must be continued for the entire 4 years. Also, the projects returns are expected to be highly correlated with returns on the firms other assets. The firm believes it could sell 2,000 units per year. The equipment would be depreciated over a 5-year period, using MACRS rates. The estimated market value of the equipment at the end of the projects 4-year life is $1 million. Pinto.coms federal-plus-state tax rate is 20%. Its cost of capital is 10% for average-risk projects, defined as projects with a coefficient of variation of NPV between 0.8 and 1.2. Low-risk projects are evaluated with an 8% project cost of capital and high-risk projects at 13%.
Please show all work in excel l
XUS Question 2 - Build a Model - Pinto.com - Excel ? x FILE HOME INSERT PAGE LAYOUT FORMULAS DATA REVIEW VIEW Stenger, Libby Times New Roma - 10 AA * Wrap Text Number Bad * Cut Eg Copy Format Painter It OX FA LO Insert Delete Format Paste BIU, A EE Merge & Center - $ - % Normal Conditional Format as Good Formatting Table Styles +8.00 Neutral AutoSum Fill- Sort & Find & Clear Filter Select- Editing Clipboard Font Alignment Number [5 Cells V J J K 1 M N 0 Q R S T U V = L51 1 X fx A B D F G H 1 Chapter: 11 Cash Flow Estimation and Risk Analysis 2 3 a. Develop a spreadsheet model, and use it to find the project's NPV, IRR, and payback. 4 5 Input Data (in thousands of dollars) 6 Scenario name Base Case Note: the items in red will be used in a scenario analysis. 7 Probability of scenario 50% 8 Equipment cost $25,000 9 Net operating working capital/Sales 12% Key Results: 10 First year sales (in units) 2,000 NPV = 11 Sales price per unit $21.00 IRR 12 Variable cost per unit (excl. depr.) $15.00 Payback = 13 Nonvariable costs (excl. depr.) $1,500 14 Inflation in prices and costs 2.5% 15 Estimated salvage value at year 4 $1,000 16 Depreciation years Year 1 Year 2 Year 3 Year 4 17 Depreciation rates 20.00% 32.00% 19.20% 11.52% 18 Tax rate 20% 19 WACC for average-risk projects 10% 20 21 Intermediate Calculations 0 1 2 3 4 22 Units sold 23 Sales price per unit (excl. depr.) 24 Variable costs per unit (excl. depr.) 25 Nonvariable costs (excl. depr.) 26 Sales revenue 27 Required level of net operating working capital 28 Basis for depreciation 29 Annual equipment depr. rate 20.00% 32.00% 19.20% 11.52% 30 Annual depreciation expense 31 Ending Bk Val: Cost - Accum Dep'rn 32 Salvage value 33 Profit (or loss) on salvage 34 Tax on profit (or loss) 35 Net cash flow due to salvage 36 Years Build a Model + READY + 100% OR 07 8 A 9 x 11:27 AM = XUS Question 2 - Build a Model - Pinto.com - Excel ? x FILE HOME INSERT PAGE LAYOUT FORMULAS DATA REVIEW VIEW Stenger, Libby AutoSum - Times New Roma - 10 AA Wrap Text Number Bad * Cut Be Copy Format Painter AY # > OX FA LO Insert Delete Format Fill- Paste BIU, A 6 3 Merge & Center - $ - % Normal Conditional Format as Good Formatting Table Styles +8.00 Neutral Clear Sort & Find & Filter Select- Editing Clipboard Font Alignment Number [5 Cells J K 1 M N 0 Q R S T U V E 0 F 1 G 2 . 3 1 4 L51 : x fc A B C D 37 Cash Flow Forecast 38 Sales revenue 39 Variable costs 40 Nonvariable operating costs 41 Depreciation (equipment) 42 Oper. income before taxes (EBIT) 43 Taxes on operating income (20%) 44 Net operating profit after taxes 45 Add back depreciation 46 Equipment purchases 47 Cash flow due to change in NOWC 48 Net cash flow due to salvage 49 Net Cash Flow (Time line of cash flows) 50 51 Key Results: Appraisal of the Proposed Project 52 53 Net Present Value (at 10%) = 54 IRR = 55 MIRR = 56 Payback 57 Discounted Payback = 58 Data for Payback Years 59 60 Net cash flow 61 Cumulative CF 62 Part of year required for payback 63 64 65 Data for Discounted Payback Years 66 67 Net cash flow 68 Discounted cash flow 69 Cumulative CF 70 Part of year required for discounted payback 71 72 Years 2 0 1 3 4 0 $0 1 $0 Years 2 $0 3 $0 4 $0 Build a Model + READY + 100% H OP 07 8 A 9 x 11:28 AM = XUS Question 2 - Build a Model - Pinto.com - Excel ? x FILE HOME INSERT PAGE LAYOUT FORMULAS DATA REVIEW VIEW Stenger, Libby Times New Roma - 10 AA * Wrap Text Number Bad * Cut Eg Copy Format Painter It OX FA LO Insert Delete Format Paste BIU, A EE Merge & Center - $ - % Normal Conditional Format as Good Formatting Table Styles +8.00 Neutral AutoSum Fill- Sort & Find & Clear Filter Select- Editing Clipboard Font Alignment Number [5 Cells V J J K 1 M N 0 Q R S T U V = L51 1 X fx A B D F G H 1 Chapter: 11 Cash Flow Estimation and Risk Analysis 2 3 a. Develop a spreadsheet model, and use it to find the project's NPV, IRR, and payback. 4 5 Input Data (in thousands of dollars) 6 Scenario name Base Case Note: the items in red will be used in a scenario analysis. 7 Probability of scenario 50% 8 Equipment cost $25,000 9 Net operating working capital/Sales 12% Key Results: 10 First year sales (in units) 2,000 NPV = 11 Sales price per unit $21.00 IRR 12 Variable cost per unit (excl. depr.) $15.00 Payback = 13 Nonvariable costs (excl. depr.) $1,500 14 Inflation in prices and costs 2.5% 15 Estimated salvage value at year 4 $1,000 16 Depreciation years Year 1 Year 2 Year 3 Year 4 17 Depreciation rates 20.00% 32.00% 19.20% 11.52% 18 Tax rate 20% 19 WACC for average-risk projects 10% 20 21 Intermediate Calculations 0 1 2 3 4 22 Units sold 23 Sales price per unit (excl. depr.) 24 Variable costs per unit (excl. depr.) 25 Nonvariable costs (excl. depr.) 26 Sales revenue 27 Required level of net operating working capital 28 Basis for depreciation 29 Annual equipment depr. rate 20.00% 32.00% 19.20% 11.52% 30 Annual depreciation expense 31 Ending Bk Val: Cost - Accum Dep'rn 32 Salvage value 33 Profit (or loss) on salvage 34 Tax on profit (or loss) 35 Net cash flow due to salvage 36 Years Build a Model + READY + 100% OR 07 8 A 9 x 11:27 AM = XUS Question 2 - Build a Model - Pinto.com - Excel ? x FILE HOME INSERT PAGE LAYOUT FORMULAS DATA REVIEW VIEW Stenger, Libby AutoSum - Times New Roma - 10 AA Wrap Text Number Bad * Cut Be Copy Format Painter AY # > OX FA LO Insert Delete Format Fill- Paste BIU, A 6 3 Merge & Center - $ - % Normal Conditional Format as Good Formatting Table Styles +8.00 Neutral Clear Sort & Find & Filter Select- Editing Clipboard Font Alignment Number [5 Cells J K 1 M N 0 Q R S T U V E 0 F 1 G 2 . 3 1 4 L51 : x fc A B C D 37 Cash Flow Forecast 38 Sales revenue 39 Variable costs 40 Nonvariable operating costs 41 Depreciation (equipment) 42 Oper. income before taxes (EBIT) 43 Taxes on operating income (20%) 44 Net operating profit after taxes 45 Add back depreciation 46 Equipment purchases 47 Cash flow due to change in NOWC 48 Net cash flow due to salvage 49 Net Cash Flow (Time line of cash flows) 50 51 Key Results: Appraisal of the Proposed Project 52 53 Net Present Value (at 10%) = 54 IRR = 55 MIRR = 56 Payback 57 Discounted Payback = 58 Data for Payback Years 59 60 Net cash flow 61 Cumulative CF 62 Part of year required for payback 63 64 65 Data for Discounted Payback Years 66 67 Net cash flow 68 Discounted cash flow 69 Cumulative CF 70 Part of year required for discounted payback 71 72 Years 2 0 1 3 4 0 $0 1 $0 Years 2 $0 3 $0 4 $0 Build a Model + READY + 100% H OP 07 8 A 9 x 11:28 AM =
Step by Step Solution
There are 3 Steps involved in it

Get step-by-step solutions from verified subject matter experts