

Question: Pivot Tables allow you to create reports on a new spreadsheet from data stored on a separate, often large spreadsheet. Employers tell us that
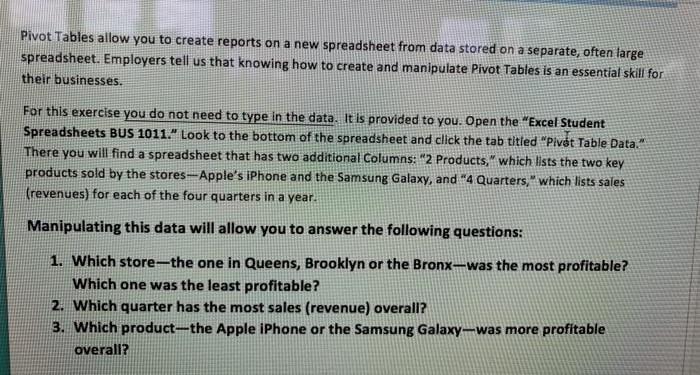
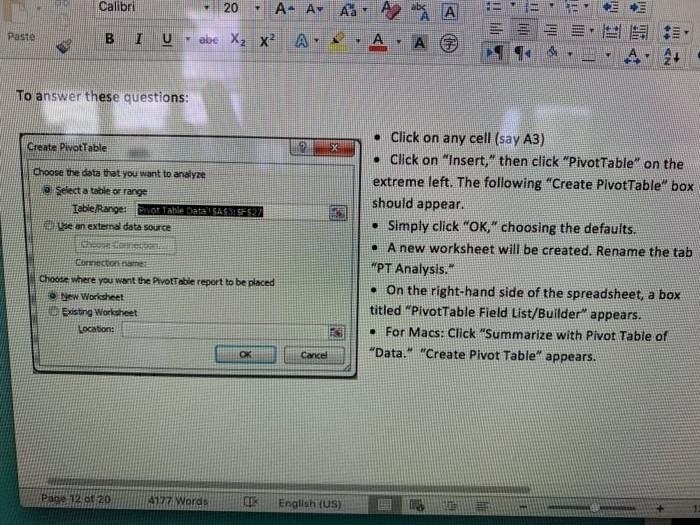
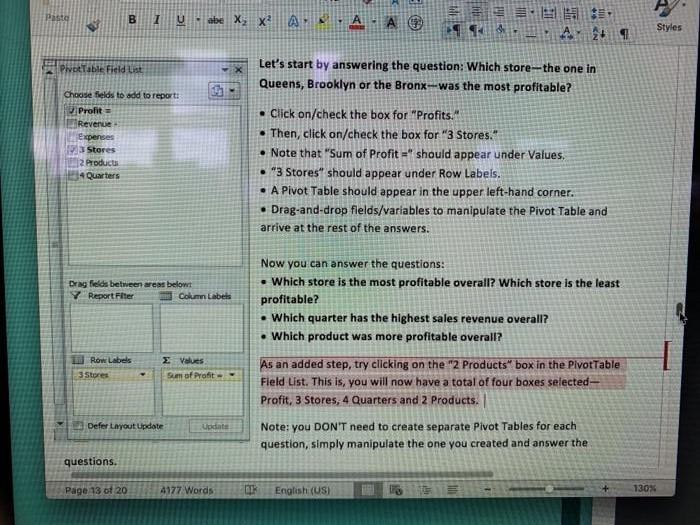
Pivot Tables allow you to create reports on a new spreadsheet from data stored on a separate, often large spreadsheet. Employers tell us that knowing how to create and manipulate Pivot Tables is an essential skill for their businesses. For this exercise you do not need to type in the data. It is provided to you. Open the "Excel Student Spreadsheets BUS 1011." Look to the bottom of the spreadsheet and click the tab titled "Pivat Table Data." There you will find a spreadsheet that has two additional Columns: "2 Products," which lists the two key products sold by the stores-Apple's iPhone and the Samsung Galaxy, and "4 Quarters," which lists sales (revenues) for each of the four quarters in a year. Manipulating this data will allow you to answer the following questions: 1. Which store-the one in Queens, Brooklyn or the Bronx-was the most profitable? Which one was the least profitable? 2. Which quarter has the most sales (revenue) overall? 3. Which product-the Apple iPhone or the Samsung Galaxy-was more profitable overall? Calibri 20 A- Av A A Paste B. IU abe X, x A A 2+ To answer these questions: Click on any cell (say A3) Click on "Insert," then click "PivotTable" on the Create PivotTable Choose the data that you want to analyze extreme left. The following "Create PivotTable" box O Select a table or range should appear. Iable/Range: vor Table Data' SASSES2 Simply click "OK," choosing the defaults. A new worksheet will be created. Rename the tab "PT Analysis." On the right-hand side of the spreadsheet, a box titled "PivotTable Field List/Builder" appears. e an external data source Connecton name Choose where you want the PvotTable report to be placed O New Worksheet Disting Worksheet For Macs: Click "Summarize with Pivot Table of "Data." "Create Pivot Table" appears. Location: OK Cancel Page 12 ot 20 4177 Words English (US) A, * - A - A O , Pasta abe X X Styles PivotTable Field List Let's start by answering the question: Which store-the one in Queens, Brooklyn or the Bronx--was the most profitable? Choose fields to add to reporti Profit = Revenue Expenses Click on/check the box for "Profits." Then, click on/check the box for "3 Stores." MStores Note that "Sum of Profit =" should appear under Values, 2 Products "3 Stores" should appear under Row Labels. A Pivot Table should appear in the upper left-hand corner. 4Quarters Drag-and-drop flelds/variables to manipulate the Pivot Table and arrive at the rest of the answers. Now you can answer the questions: Drag felds between areas belowt Which store is the most profitable overall? Which store is the least V Report Fiter O Column Labels profitable? Which quarter has the highest sales revenue overall? Which product was more profitable overall? Row Labels E values As an added step, try clicking on the "2 Products" box in the PivotTable 3Stores Sum of Profit Field List. This is, you will now have a total of four boxes selected- Profit, 3 Stores, 4 Quarters and 2 Products. Defer Layout Update Update Note: you DON'T need to create separate Pivot Tables for each question, simply manipulate the one you created and answer the questions. Page 13 of 20 4177 Words English (USI 130% B.
Step by Step Solution
3.54 Rating (171 Votes )
There are 3 Steps involved in it
Answer 1 Answer 2 Answer 3 Row Labels Sum of Profit Bronx 4600 Brook... View full answer

Get step-by-step solutions from verified subject matter experts