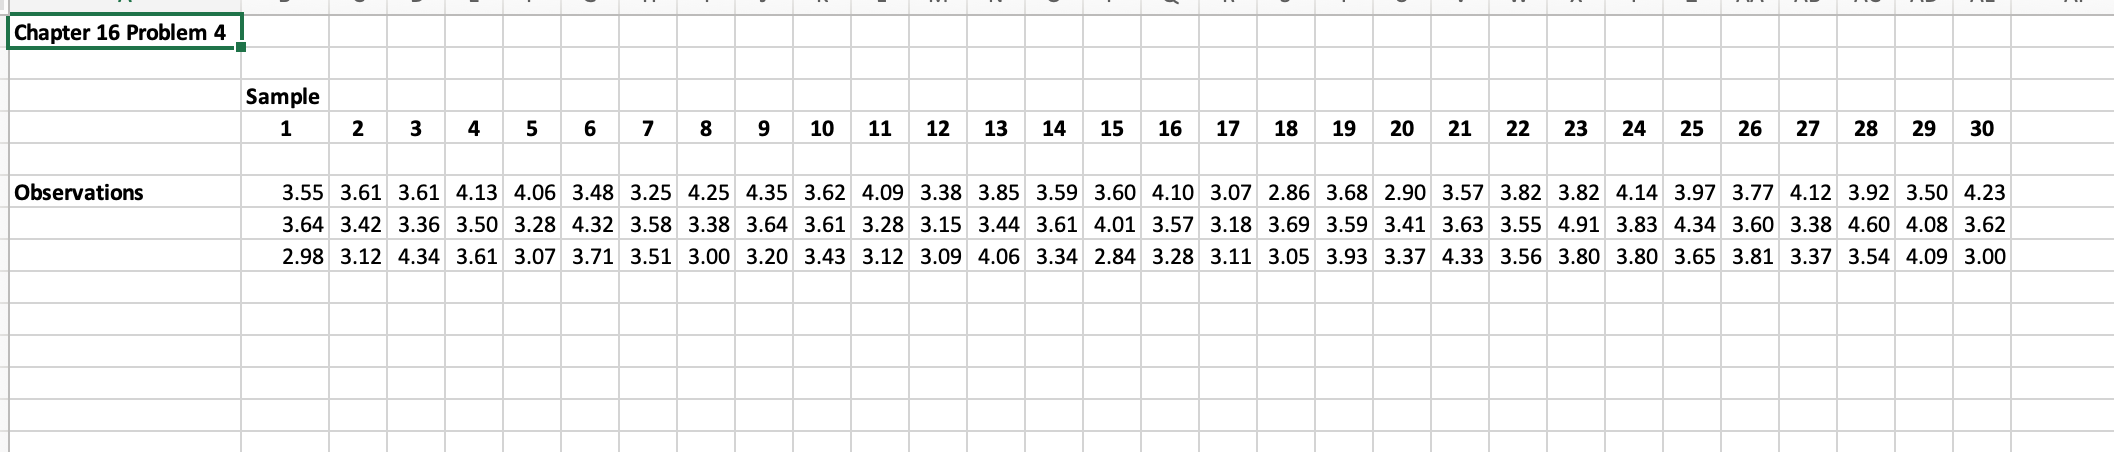
Question: pl 14.* Use the data in problem 4 to calculate C,, C Cu> and Cyk, assuming that the specifications are 3.75 + 1.25. Interpret the

pl 14.* Use the data in problem 4 to calculatepl 14.* Use the data in problem 4 to calculatepl 14.* Use the data in problem 4 to calculate

pl 14.* Use the data in problem 4 to calculate C,, C Cu> and Cyk, assuming that the specifications are 3.75 + 1.25. Interpret the results for the manager of this process. Chapter 16 Problem 4 Sample 1 2 10 11 12 13 14 15 16 17 18 19 20 21 22 23 24 25 26 27 28 29 30 Observations 3.55 3.61 3.61 4.13 4.06 3.48 3.25 4.25 4.35 3.62 4.09 3.38 3.85 3.59 3.60 4.10 3.07 2.86 3.68 2.90 3.57 3.82 3.82 4.14 3.97 3.77 4.12 3.92 3.50 4.23 3.64 3.42 3.36 3.50 3.28 4.32 3.58 3.38 3.64 3.61 3.28 3.15 3.44 3.61 4.01 3.57 3.18 3.69 3.59 3.41 3.63 3.55 4.91 3.83 4.34 3.60 3.38 4.60 4.08 3.62 2.98 3.12 4.34 3.61 3.07 3.71 3.51 3.00 3.20 3.43 3.12 3.09 4.06 3.34 2.84 3.28 3.11 3.05 3.93 3.37 4.33 3.56 3.80 3.80 3.65 3.81 3.37 3.54 4.09 3.00 4.* Thirty samples of size 3, available in the C16P4 worksheet at OM Online, were taken from a machining process over a 15-hour period. Construct control charts using the Excel x- and R-chart template. Verify the Excel calculations of the control limits by hand using the formulas in the chapter. Does the process appear to be in statistical control? Why or why not

Step by Step Solution

There are 3 Steps involved in it

1 Expert Approved Answer
Step: 1 Unlock blur-text-image
Question Has Been Solved by an Expert!

Get step-by-step solutions from verified subject matter experts

Step: 2 Unlock
Step: 3 Unlock

Students Have Also Explored These Related General Management Questions!