

Question: PLANETARY MOTION: A student obtained the graph below after plotting the values of square of distance and force between two spheres. What does the graph
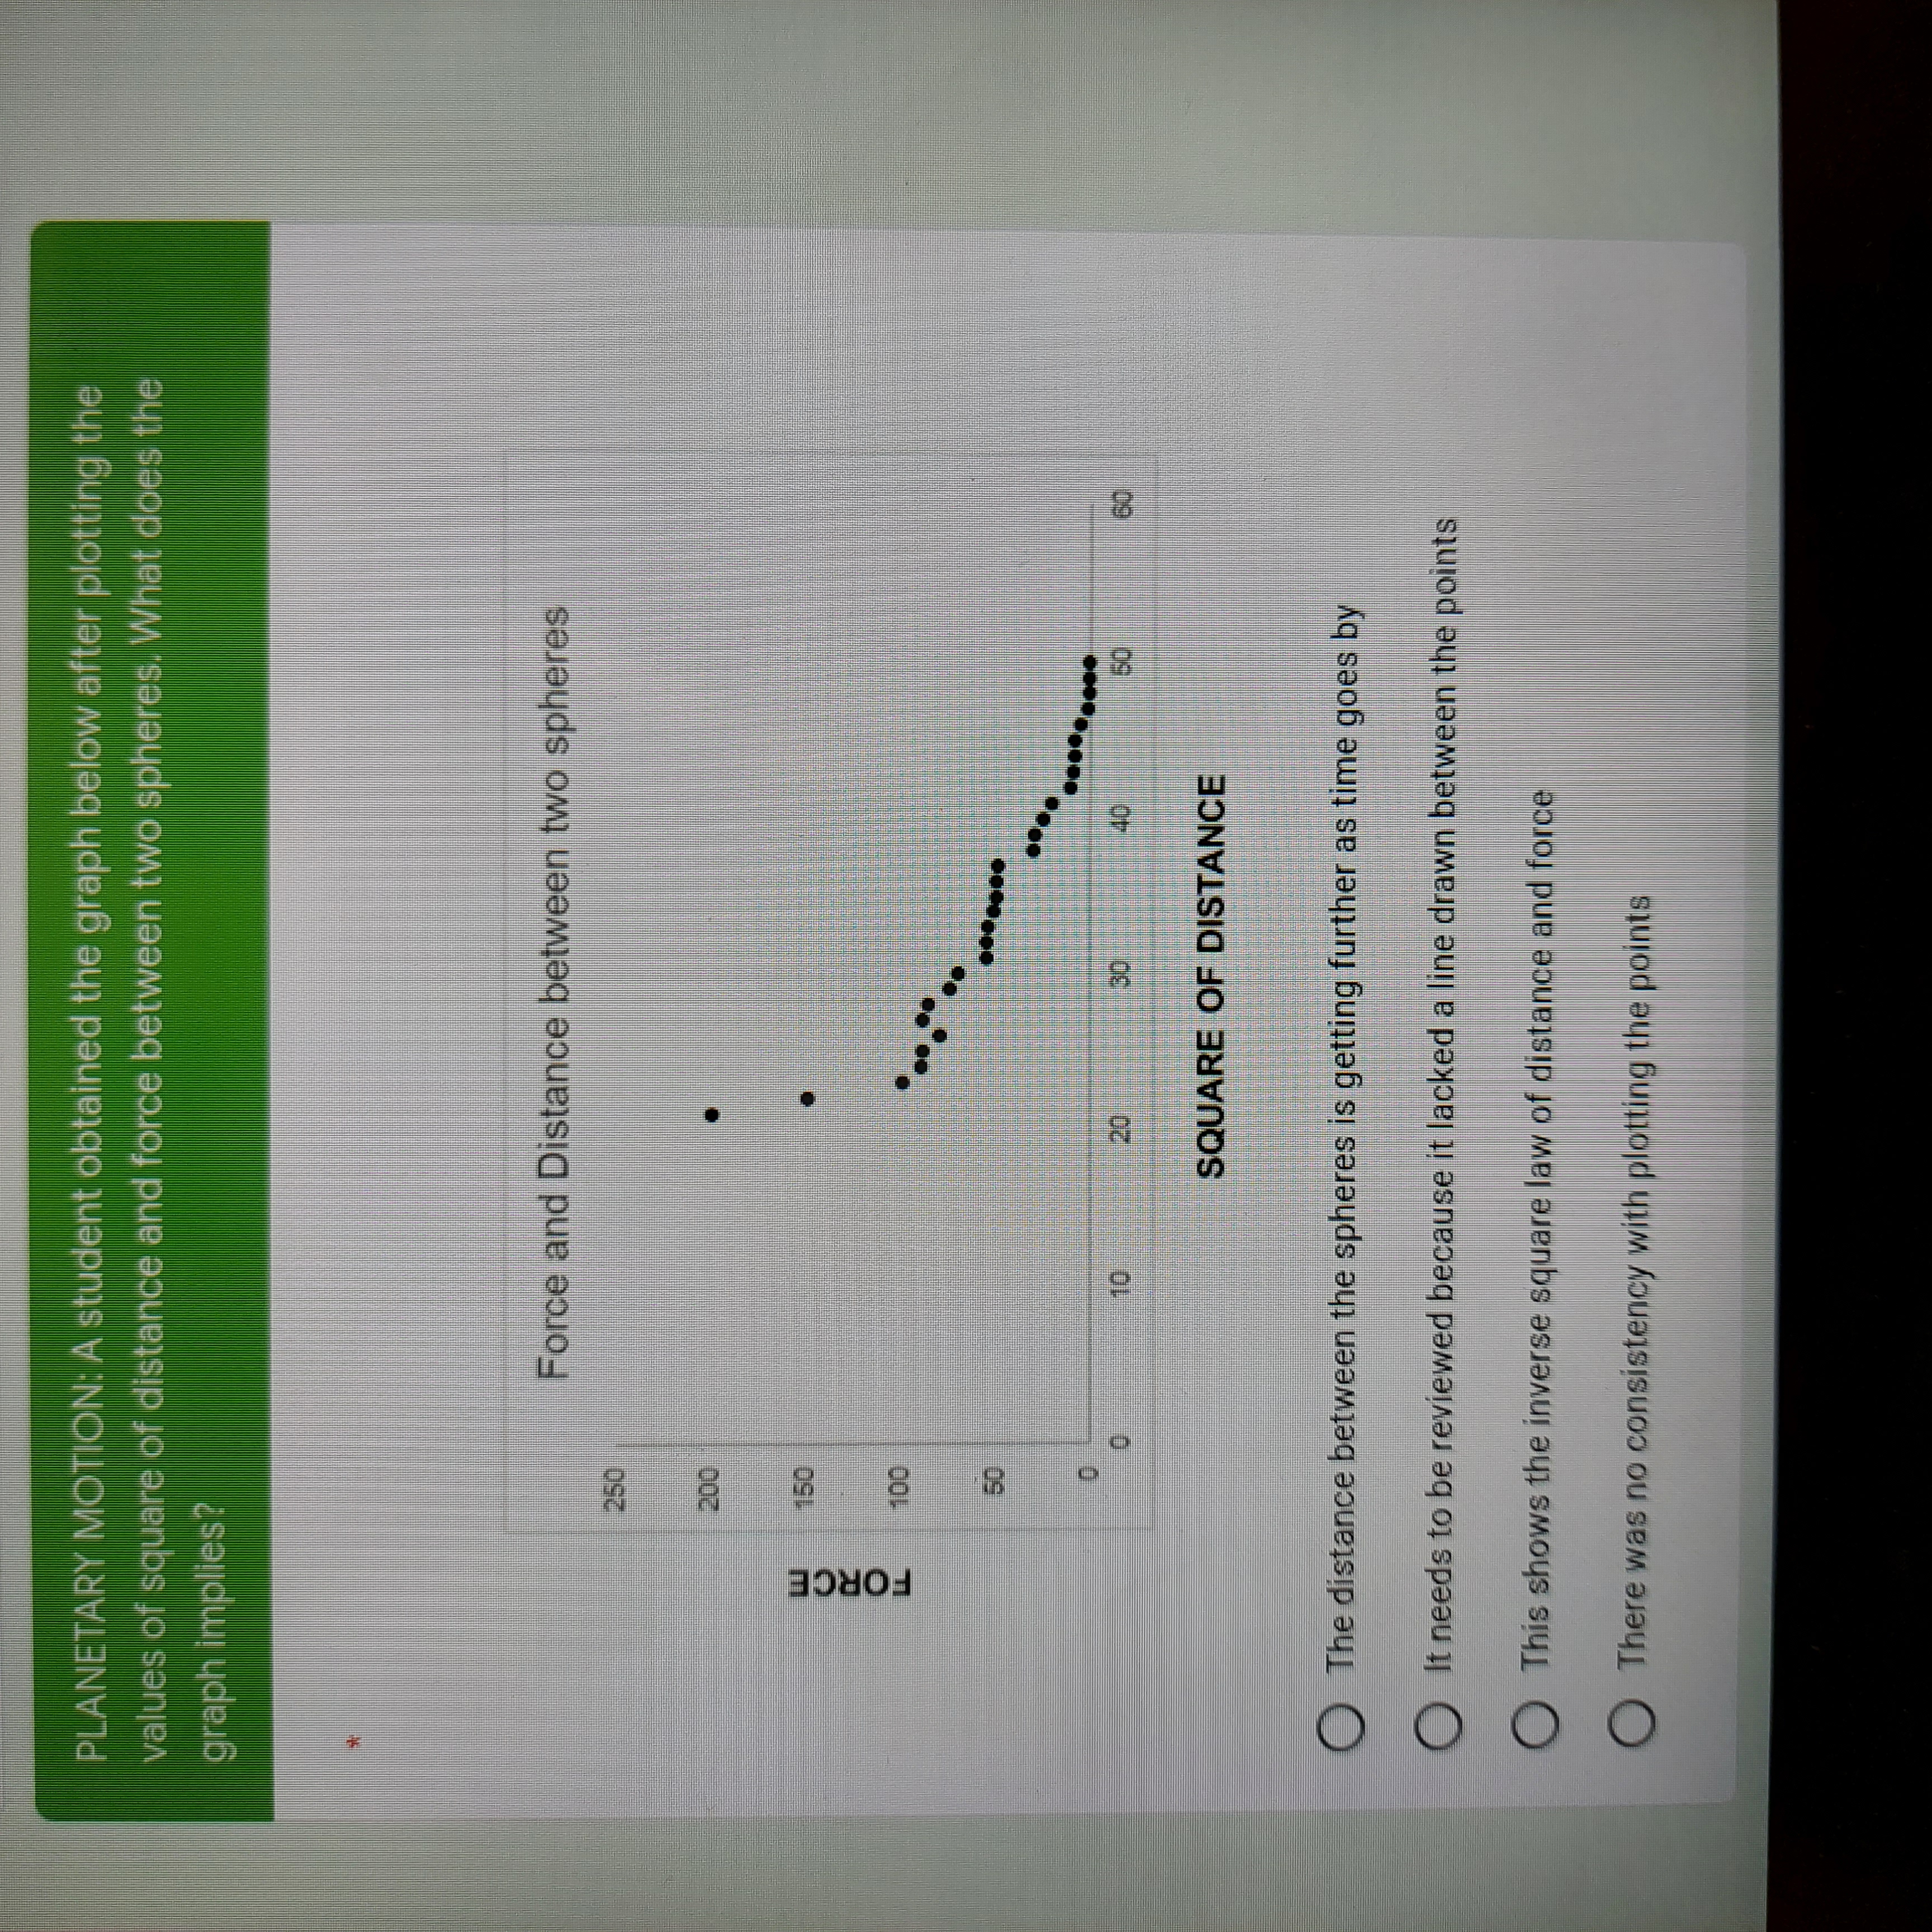
PLANETARY MOTION: A student obtained the graph below after plotting the values of square of distance and force between two spheres. What does the graph implies ? Force and Distance between two spheres 250 200 150 FORCE 100 40 SQUARE OF DISTANCE The distance between the spheres is getting further as time goes by O It needs to be reviewed because it lacked a line drawn between the points O This shows the inverse square law of distance and force There was no consistency with plotting the points
Step by Step Solution
There are 3 Steps involved in it
1 Expert Approved Answer
Step: 1 Unlock

Question Has Been Solved by an Expert!
Get step-by-step solutions from verified subject matter experts
Step: 2 Unlock
Step: 3 Unlock