

Question: Pleas help me with this assignment. Using excel will be better. 3. For this assignment use Excel, SPSS, Stata, (or other statistical analysis packages) to
Pleas help me with this assignment. Using excel will be better.

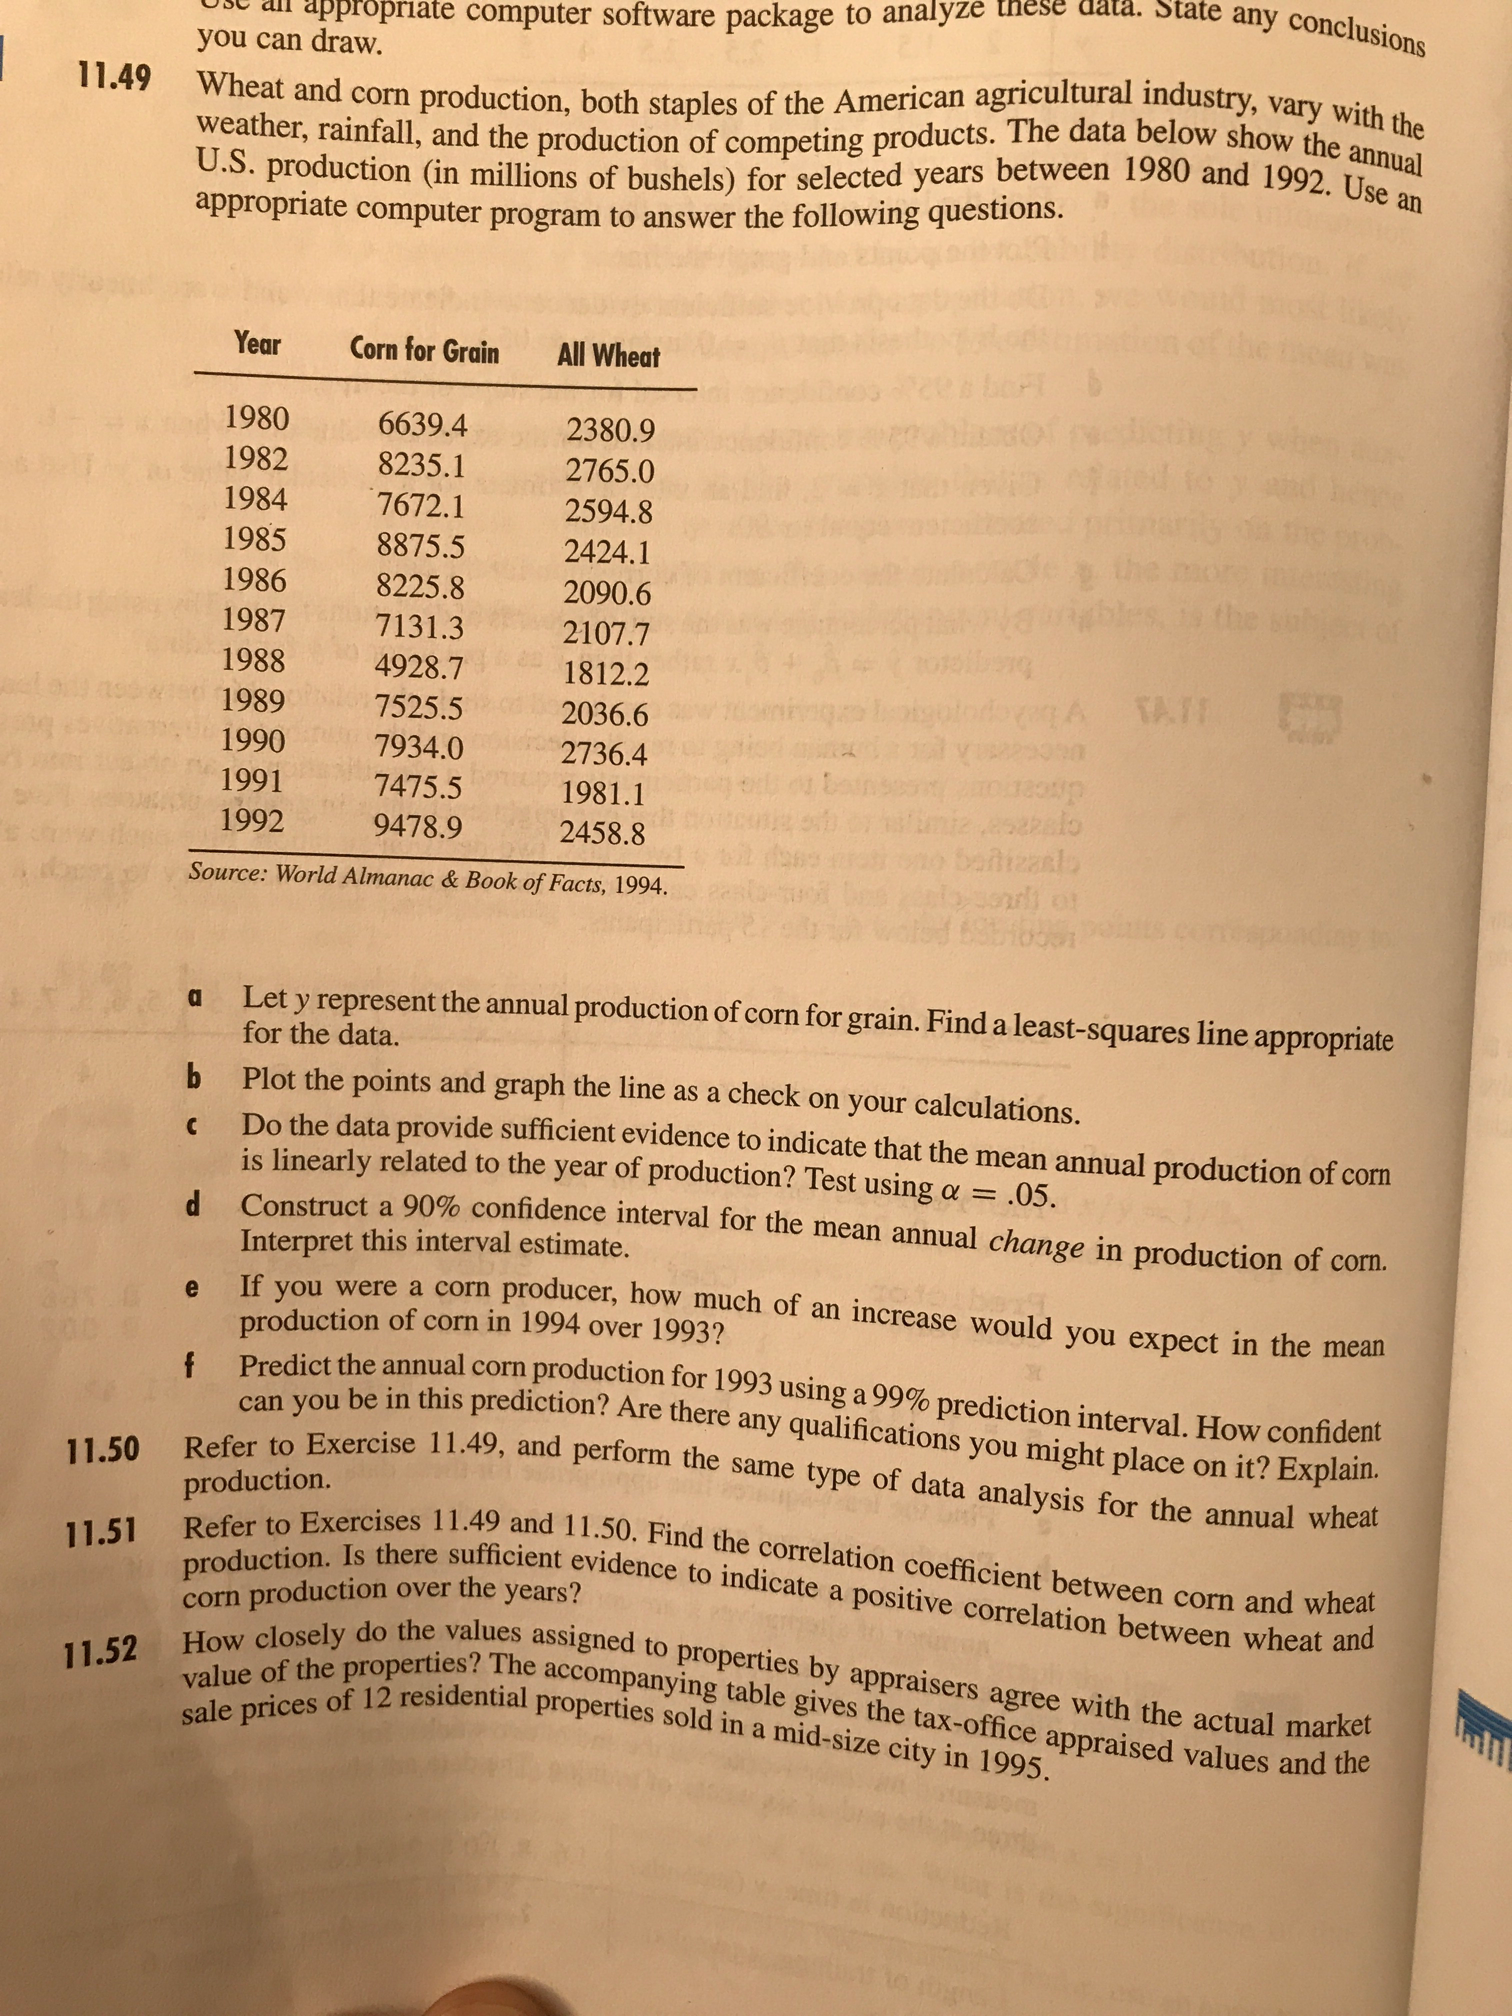
3. For this assignment use Excel, SPSS, Stata, (or other statistical analysis packages) to answer the following questions. Organize your answers as though they were case studies. Include diagrams, figures, and equations to support your answers. Enter the required data foontained in the text book); generate the tables and diagrams that correspond with Exercises: 11 49. 11.50, and 11.51 (soo page 508ppropriate computer software package to analyze these data. State any conclusions you can draw. 11.49 Wheat and corn production, both staples of the American agricultural industry, vary with the weather, rainfall, and the production of competing products. The data below show the annual U.S. production (in millions of bushels) for selected years between 1980 and 1992. Use appropriate computer program to answer the following questions. Year Corn for Grain All Wheat 1980 6639.4 2380.9 1982 8235.1 2765.0 fotell to y and he 1984 7672.1 2594.8 1985 8875.5 2424.1 1986 8225.8 2090.6 audey the more ing 1987 7131.3 2107.7 mawagbles is the bal 1988 4928.7 1812.2 1989 7525.5 2036.6 ange Leoigotodoveq A TATI 1990 7934.0 2736.4 1991 7475.5 1981.1 B ou bain seat 1992 9478.9 2458.8 but dans well ono baflizaal Source: World Almanac & Book of Facts, 1994. 68916061 Let y represent the annual production of corn for grain. Find a least-squares line appropriate for the data. Plot the points and graph the line as a check on your calculations. Do the data provide sufficient evidence to indicate that the mean annual production of corn is linearly related to the year of production? Test using a = .05. d Construct a 90% confidence interval for the mean annual change in production of corn. Interpret this interval estimate. e If you were a corn producer, how much of an increase would you expect in the mean production of corn in 1994 over 1993? Predict the annual corn production for 1993 using a 99% prediction interval. How confident 11.50 can you be in this prediction? Are there any qualifications you might place on it? Explain. Refer to Exercise 11.49, and perform the same type of data analysis for the annual wheat production. 11.51 Refer to Exercises 11.40 and 1 1.50. Find the correlation coefficient between corn and wheat production. Is the corn production over t Is there sufficient evidence to indicate a positive correlation between wheat and over the years? 11.52 How closely do the values assigned to properties by appraisers agree with the actual market value of the properties? The accompanying table gives the tax-office appraised values and the sale prices of 12 residential properties sold in a mid-size city in 1995
Step by Step Solution
There are 3 Steps involved in it

Get step-by-step solutions from verified subject matter experts