

Question: /*-+ PLEAS USE MATH LAB ASAP Read the write-up carefully before proceeding! In this lab, you will work in groups of 2 to write simple
 /*-+
/*-+
 PLEAS USE MATH LAB
ASAP
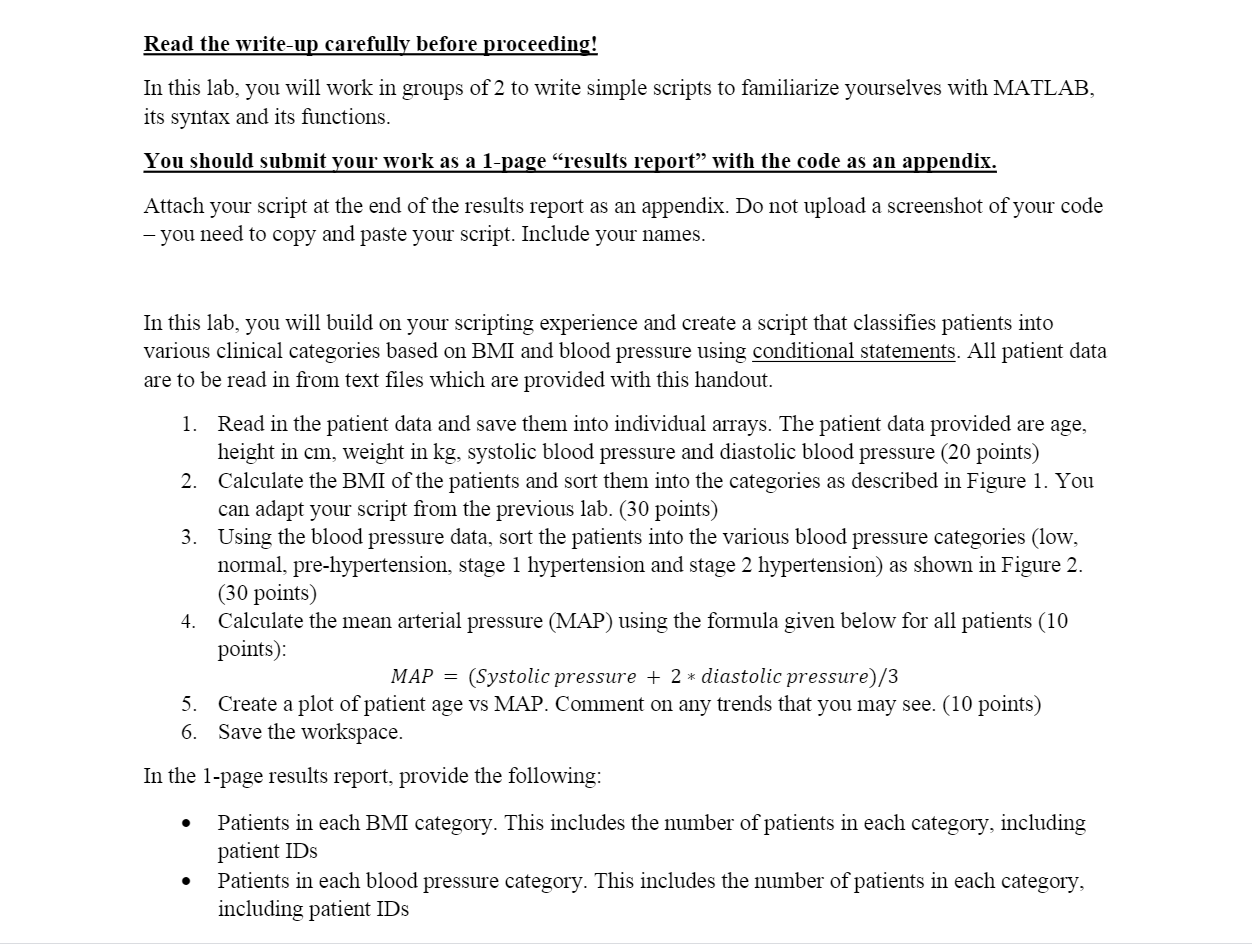
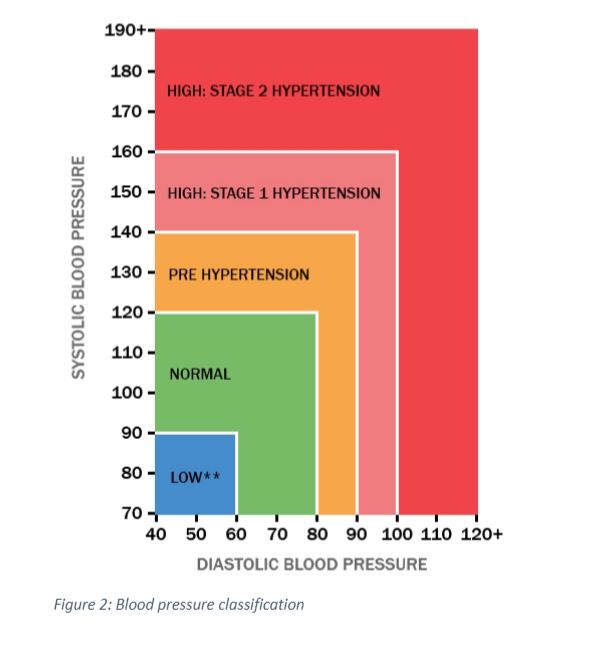
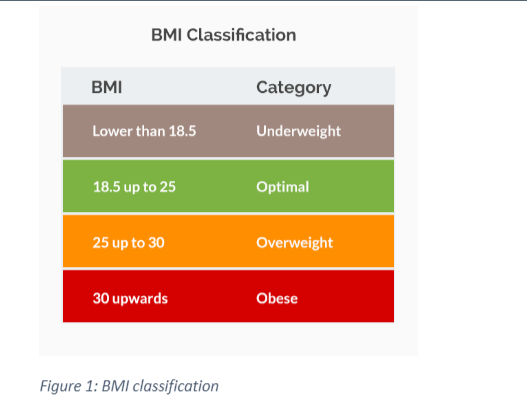
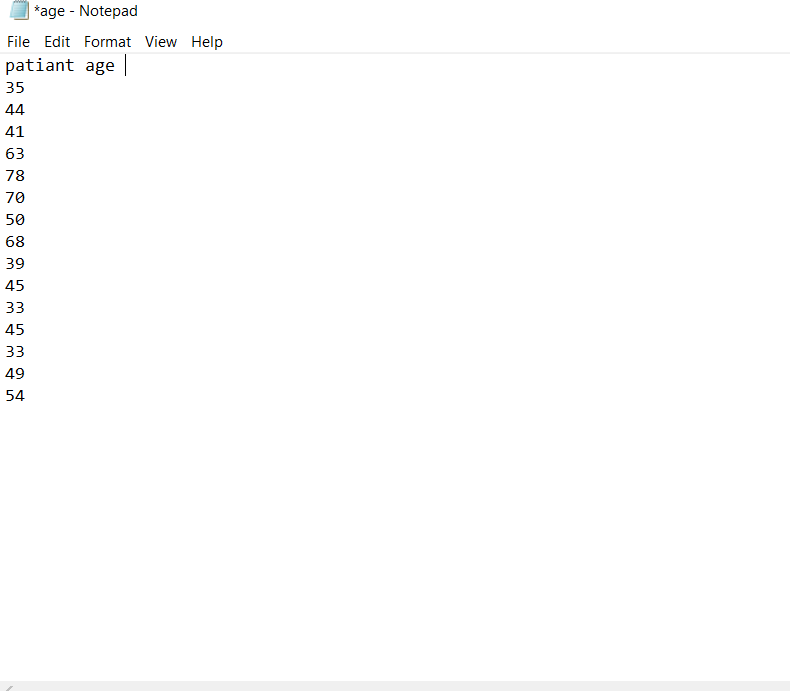
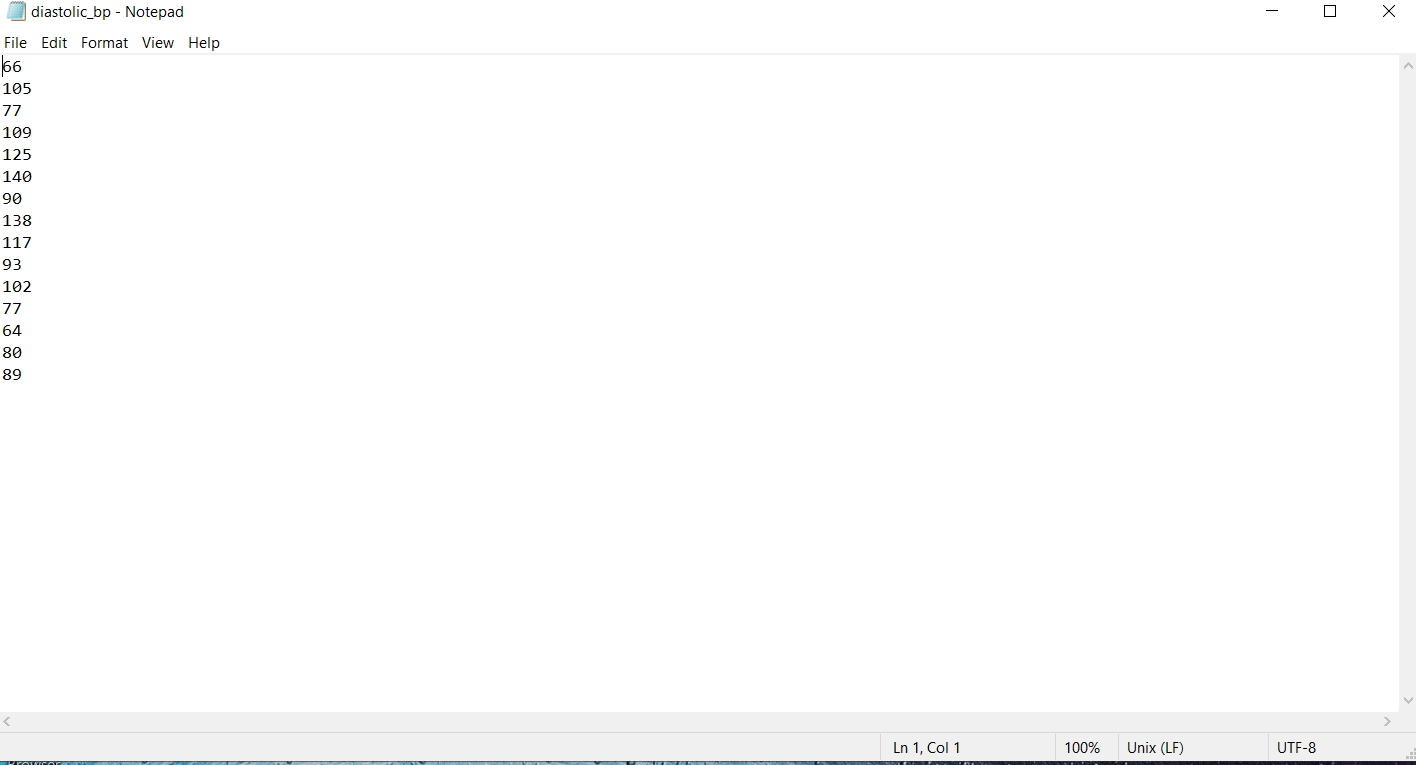
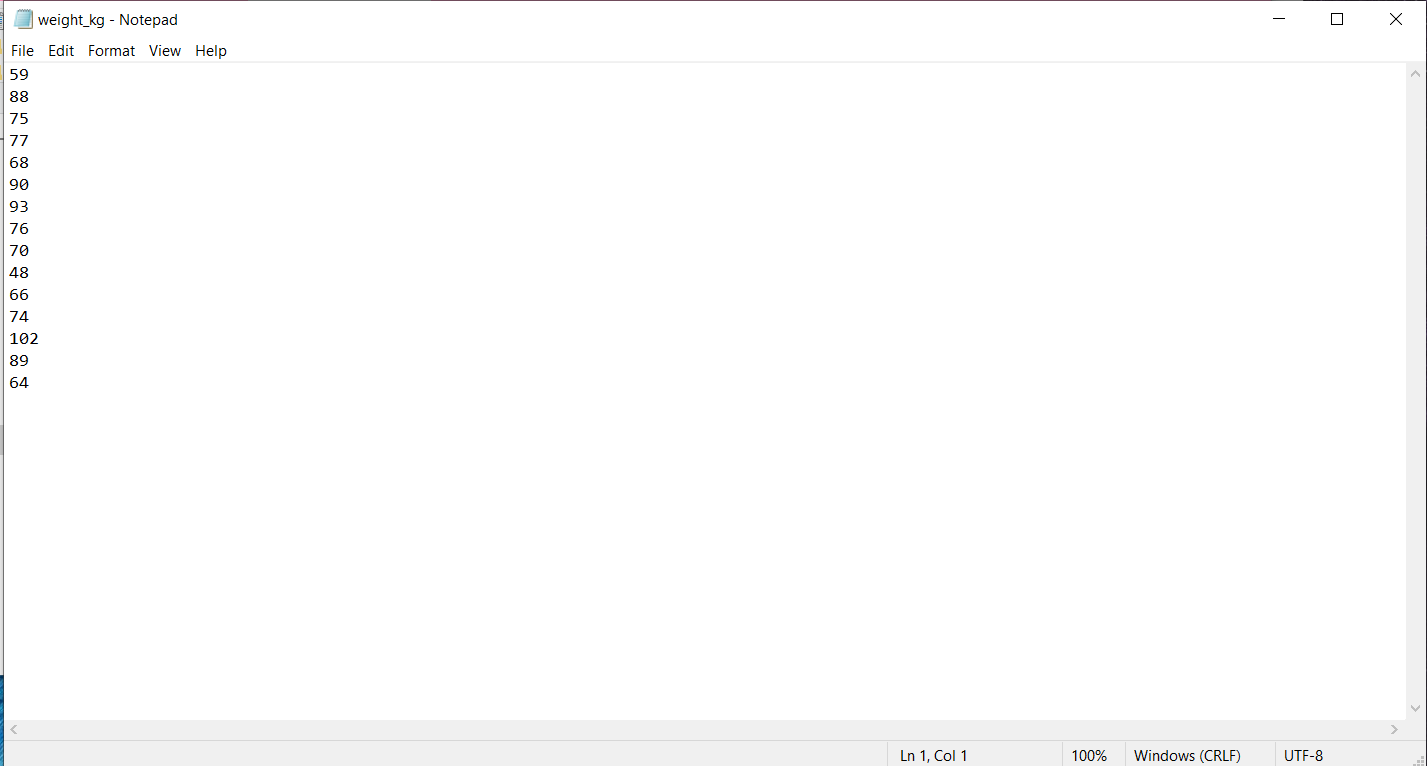
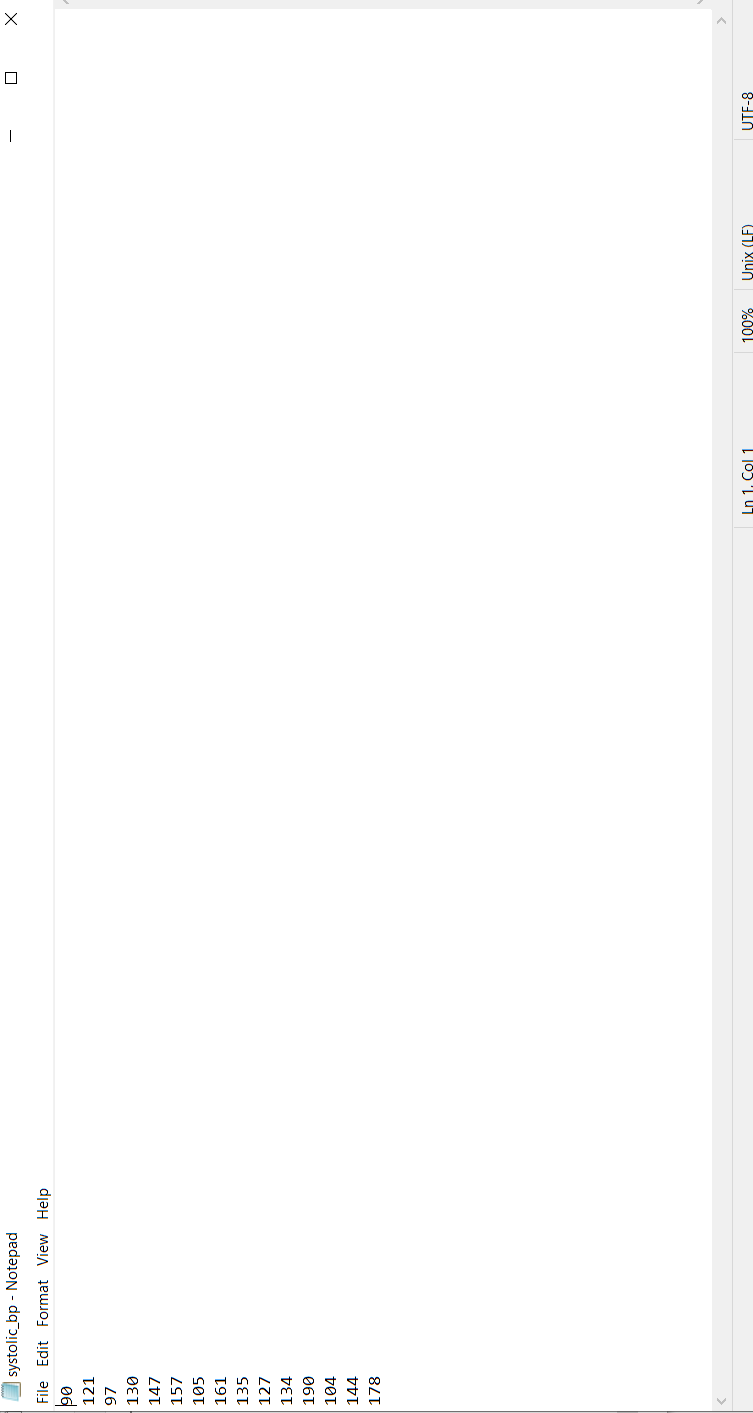
Read the write-up carefully before proceeding! In this lab, you will work in groups of 2 to write simple scripts to familiarize yourselves with MATLAB, its syntax and its functions. You should submit your work as a 1-page "results report with the code as an appendix. Attach your script at the end of the results report as an appendix. Do not upload a screenshot of your code - you need to copy and paste your script. Include your names. In this lab, you will build on your scripting experience and create a script that classifies patients into various clinical categories based on BMI and blood pressure using conditional statements. All patient data are to be read in from text files which are provided with this handout. 1. Read in the patient data and save them into individual arrays. The patient data provided are age, height in cm, weight in kg, systolic blood pressure and diastolic blood pressure (20 points) 2. Calculate the BMI of the patients and sort them into the categories as described in Figure 1. You can adapt your script from the previous lab. (30 points) 3. Using the blood pressure data, sort the patients into the various blood pressure categories (low, normal, pre-hypertension, stage 1 hypertension and stage 2 hypertension) as shown in Figure 2. (30 points) 4. Calculate the mean arterial pressure (MAP) using the formula given below for all patients (10 points) MAP = (Systolic pressure + 2 * diastolic pressure)/3 5. Create a plot of patient age vs MAP. Comment on any trends that you may see. (10 points) 6. Save the workspace. In the 1-page results report, provide the following: Patients in each BMI category. This includes the number of patients in each category, including patient IDs Patients in each blood pressure category. This includes the number of patients in each category, including patient IDs 190+- 180 HIGH: STAGE 2 HYPERTENSION 170 160 150 - HIGH: STAGE 1 HYPERTENSION 140 SYSTOLIC BLOOD PRESSURE 130 - PRE HYPERTENSION 120 110 NORMAL 100 - 90 80 - LOW** 70 40 50 60 70 80 90 100 110 120+ DIASTOLIC BLOOD PRESSURE Figure 2: Blood pressure classification BMI Classification BMI Category Lower than 18.5 Underweight 18.5 up to 25 Optimal 25 up to 30 Overweight 30 upwards Obese Figure 1: BMI classification *age - Notepad File Edit Format View Help patiant age | 35 44 41 63 78 70 50 68 39 45 33 45 33 49 54 diastolic_bp - Notepad File Edit Format View Help 66 105 77 109 125 140 90 138 117 93 102 77 64 80 89 Ln 1, Col 1 100% Unix (LF) UTF-8 height_cm - Notepad File Edit Format View Help 159 185 170 169 163 180 177 168 175 145 133 177 189 164 192 In 1 Col 1 100% Windows (CRLE) UTF-8 weight_kg - Notepad - File Edit Format View Help 59 88 75 77 68 90 93 76 70 48 66 74 102 89 64 Ln 1, Col 1 100% Windows (CRLF) UTF-8 systolic_bp - Notepad - File Edit Format View Help 90 121 97 130 147 157 105 161 135 127 134 190 104 144 178 Ln 1 Col 1 100% Unix (LF) UTF-8
Step by Step Solution
There are 3 Steps involved in it

Get step-by-step solutions from verified subject matter experts