

Question: please a good expert help me to solve this case study Project Description: Investing in renewable energy is a key strategy of the UAE to
please a good expert help me to solve this case study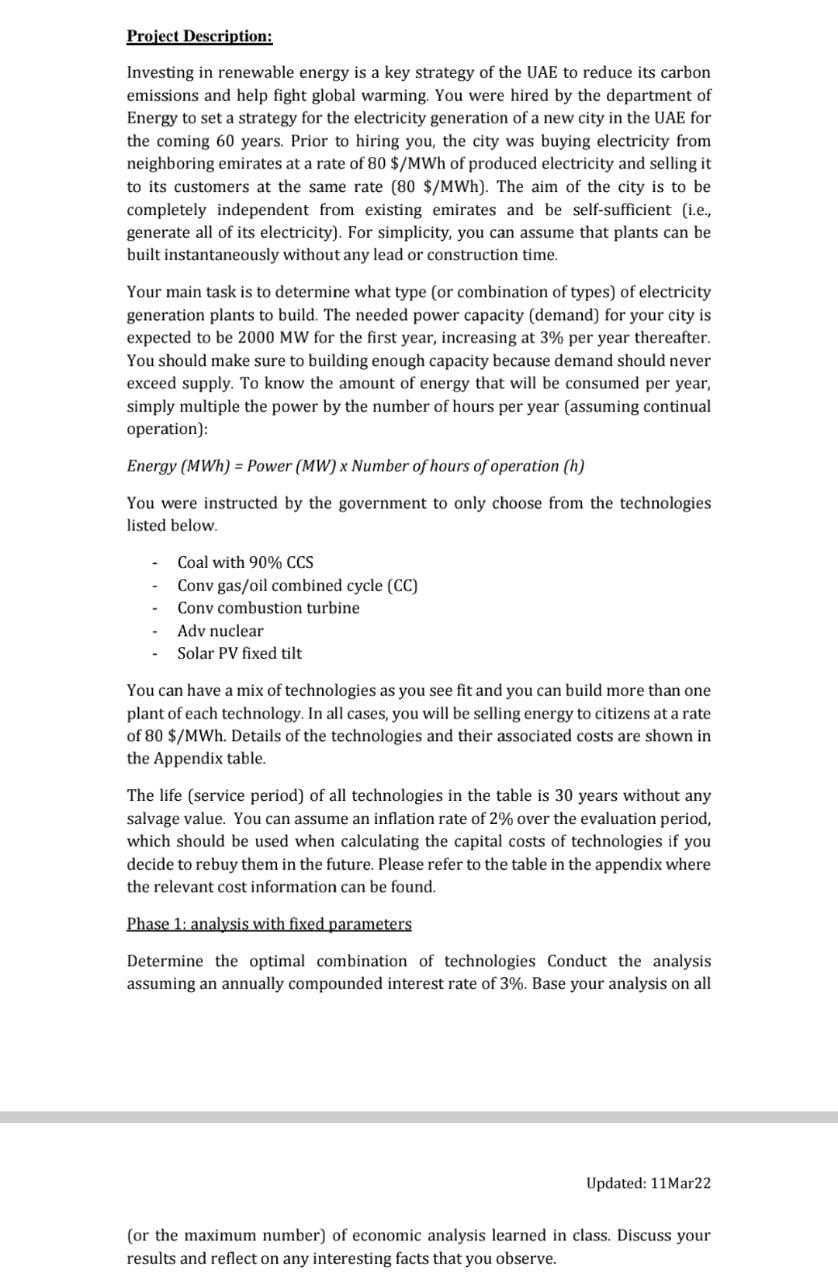
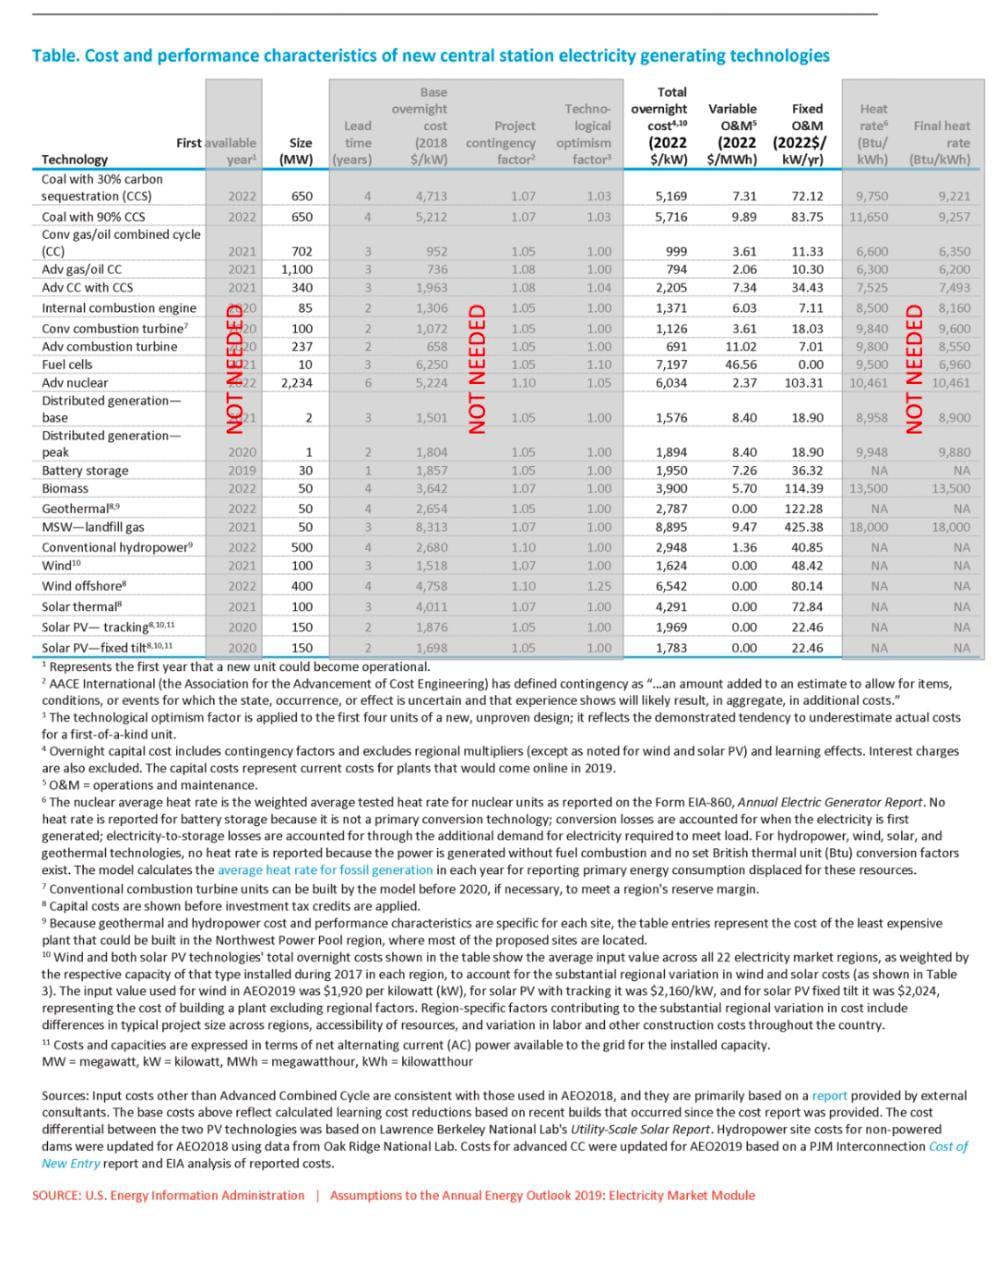
Project Description: Investing in renewable energy is a key strategy of the UAE to reduce its carbon emissions and help fight global warming. You were hired by the department of Energy to set a strategy for the electricity generation of a new city in the UAE for the coming 60 years. Prior to hiring you, the city was buying electricity from neighboring emirates at a rate of 80 $/MWh of produced electricity and selling it to its customers at the same rate (80 $/MWh). The aim of the city is to be completely independent from existing emirates and be self-sufficient (i.e., generate all of its electricity). For simplicity, you can assume that plants can be built instantaneously without any lead or construction time. Your main task is to determine what type (or combination of types) of electricity generation plants to build. The needed power capacity (demand) for your city is expected to be 2000 MW for the first year, increasing at 3% per year thereafter. You should make sure to building enough capacity because demand should never exceed supply. To know the amount of energy that will be consumed per year, simply multiple the power by the number of hours per year (assuming continual operation): Energy (MWh) = Power (MW) x Number of hours of operation (h) You were instructed by the government to only choose from the technologies listed below. Coal with 90% CCS Conv gas/oil combined cycle (CC) Conv combustion turbine Adv nuclear Solar PV fixed tilt You can have a mix of technologies as you see fit and you can build more than one plant of each technology. In all cases, you will be selling energy to citizens at a rate of 80 $/MWh. Details of the technologies and their associated costs are shown in the Appendix table. The life (service period) of all technologies in the table is 30 years without any salvage value. You can assume an inflation rate of 2% over the evaluation period, which should be used when calculating the capital costs of technologies if you decide to rebuy them in the future. Please refer to the table in the appendix where the relevant cost information can be found. Phase 1: analysis with fixed parameters Determine the optimal combination of technologies Conduct the analysis assuming an annually compounded interest rate of 3%. Base your analysis on all Updated: 11Mar22 (or the maximum number) of economic analysis learned in class. Discuss your results and reflect on any interesting facts that you observe. Phase 2: uncertainty analysis In reality, factors such as "interest rate are uncertain and might have different values over time. Conduct a sensitivity analysis on the interest rate and reflect on the results. What type of technologies are becoming more attractive when the interest rate is higher? How about when it is lower? Limit your analysis to the 0- 10% range. Phase 3: beyond economic analysis What are some factors that are not accounted for in the Appendix table that might influence the choice of technologies to use? Is money the only criterion that should be used to base the strategies of cities and countries? Would the above considerations make you change the optimal combination of technologies that you identified in the previous sections? Provide your own thoughts and opinions on the topic keeping in mind the best interest of the citizens of that city. Table. Cost and performance characteristics of new central station electricity generating technologies Base Total Heat overnight cost Lead rate Techno- overnight Variable Fixed logical cost4,10 O&M O&M optimism (2022 (2022 (2022$/ factor $/kW) $/MWh) kW/yr) Final heat rate time First available year Project contingency factor Size (MW) (years) (2018 $/kW) (Btu/ kWh) (Btu/kWh) Technology Coal with 30% carbon sequestration (CCS) 2022 650 4 4,713 1.07 1.03 5,169 7.31 72.12 9,750 9,221 Coal with 90% CCS 2022 650 4 5,212 1.07 1.03 5,716 9.89 83.75 11,650 9,257 Conv gas/oil combined cycle (CC) 2021 702 3 952 1.05 1.00 999 3.61 11.33 6,600 6,350 Adv gas/oil CC 1,100 3 736 1.08 1.00 794 2.06 10.30 6,300 6,200 Adv CC with CCS 340 3 1,963 1.08 1.04 2,205 7.34 34.43 7,525 7,493 Internal combustion engine 85 2 1,306 1.05 1.00 1,371 6.03 7.11 8,500 8,160 Conv combustion turbine 20 100 2 1,072 1.05 1.00 1,126 3.61 18.03 9,840 9,600 Adv combustion turbine 720 237 2 658 1.05 1.00 691 11.02 7.01 9,800 8,550 Fuel cells L21 10 3 6,250 1.05 1.10 7,197 46.56 0.00 9,500 6,960 10,461 Adv nuclear 422 2,234 6 5,224 1.10 1.05 6,034 2.37 103.31 10,461 Distributed generation- base 21 2 3 1,501 1.05 1.00 1,576 8.40 18.90 8,958 8,900 Distributed generation- peak 2020 1 2 1,804 1.05 1.00 1,894 8.40 18.90 9,948 Battery storage 2019 30 1 1,857 1.05 1.00 1,950 7.26 36.32 NA Biomass 2022 50 4 3,642 1.07 1.00 3,900 5.70 114.39 13,500 122.28 9,880 NA 13,500 NA 18,000 Geothermal 2022 50 4 2,654 1.05 1.00 2,787 0.00 MSW-landfill gas 2021 50 3 8,313 1.07 1.00 8,895 9.47 425.38 18,000 2022 500 4 2,680 1.10 1.00 2,948 1.36 40.85 NA Conventional hydropower" Wind 10 2021 100 3 1,518 1.07 1.00 1,624 0.00 48.42 NA Wind offshore 2022 400 4 4,758 1.10 1.25 6,542 0.00 80.14 Solar thermal" 2021 100 3 4,011 1.07 1.00 4,291 0.00 72.84 NA Solar PV-tracking,10,11 2020 150 2 1,876 1.05 1.00 1,969 0.00 22.46 NA Solar PV-fixed tilt8,10,111 2020 150 2 1,698 1.05 1.00 1,783 0.00 22.46 NA * Represents the first year that a new unit could become operational. 2 AACE International (the Association for the Advancement of Cost Engineering) has defined contingency as "...an amount added to an estimate to allow for items, conditions, or events for which the state, occurrence, or effect is uncertain and that experience shows will likely result, in aggregate, in additional costs." The technological optimism factor is applied to the first four units of a new, unproven design; it reflects the demonstrated tendency to underestimate actual costs for a first-of-a-kind unit. * Overnight capital cost includes contingency factors and excludes regional multipliers (except as noted for wind and solar PV) and learning effects. Interest charges are also excluded. The capital costs represent current costs for plants that would come online in 2019. SO&M = operations and maintenance. The nuclear average heat rate is the weighted average tested heat rate for nuclear units as reported on the Form EIA-860, Annual Electric Generator Report. No heat rate is reported for battery storage because it is not a primary conversion technology; conversion losses are accounted for when the electricity is first generated; electricity-to-storage losses are accounted for through the additional demand for electricity required to meet load. For hydropower, wind, solar, and geothermal technologies, no heat rate is reported because the power is generated without fuel combustion and no set British thermal unit (Btu) conversion factors exist. The model calculates the average heat rate for fossil generation in each year for reporting primary energy consumption displaced for these resources. 7 Conventional combustion turbine units can be built by the model before 2020, if necessary, to meet a region's reserve margin. "Capital costs are shown before investment tax credits are applied. Because geothermal and hydropower cost and performance characteristics are specific for each site, the table entries represent the cost of the least expensive plant that could be built in the Northwest Power Pool region, where most of the proposed sites are located. 10 Wind and both solar PV technologies' total overnight costs shown in the table show the average input value across all 22 electricity market regions, as weighted by the respective capacity of that type installed during 2017 in each region, to account for the substantial regional variation in wind and solar costs (as shown in Table 3). The input value used for wind in AEO2019 was $1,920 per kilowatt (kW), for solar PV with tracking it was $2,160/kW, and for solar PV fixed tilt it was $2,024, representing the cost of building a plant excluding regional factors. Region-specific factors contributing to the substantial regional variation in cost include differences in typical project size across regions, accessibility of resources, and variation in labor and other construction costs throughout the country. 11 Costs and capacities are expressed in terms of net alternating current (AC) power available to the grid for the installed capacity. MW = megawatt, kW = kilowatt, MWh = megawatthour, kWh = kilowatthour Sources: Input costs other than Advanced Combined Cycle are consistent with those used in AEO2018, and they are primarily based on a report provided by external consultants. The base costs above reflect calculated learning cost reductions based on recent builds that occurred since the cost report was provided. The cost differential between the two PV technologies was based on Lawrence Berkeley National Lab's Utility-Scale Solar Report. Hydropower site costs for non-powered dams were updated for AEO2018 using data from Oak Ridge National Lab. Costs for advanced CC were updated for AEO2019 based on a PJM Interconnection Cost of New Entry report and EIA analysis of reported costs. SOURCE: U.S. Energy Information Administration | Assumptions to the Annual Energy Outlook 2019: Electricity Market Module DIE 2021 2021 20 NOT NEEDED NA NOT NEEDED
Step by Step Solution
There are 3 Steps involved in it

Get step-by-step solutions from verified subject matter experts