

Question: Please access the data by using: install.packages(faraway) library(faraway) data(aflatoxin) in r studio. The two problems are one. 4. Read the help file in Faraway's aflatoxin
Please access the data by using:
install.packages("faraway")
library(faraway)
data(aflatoxin)
in r studio.
The two problems are one.
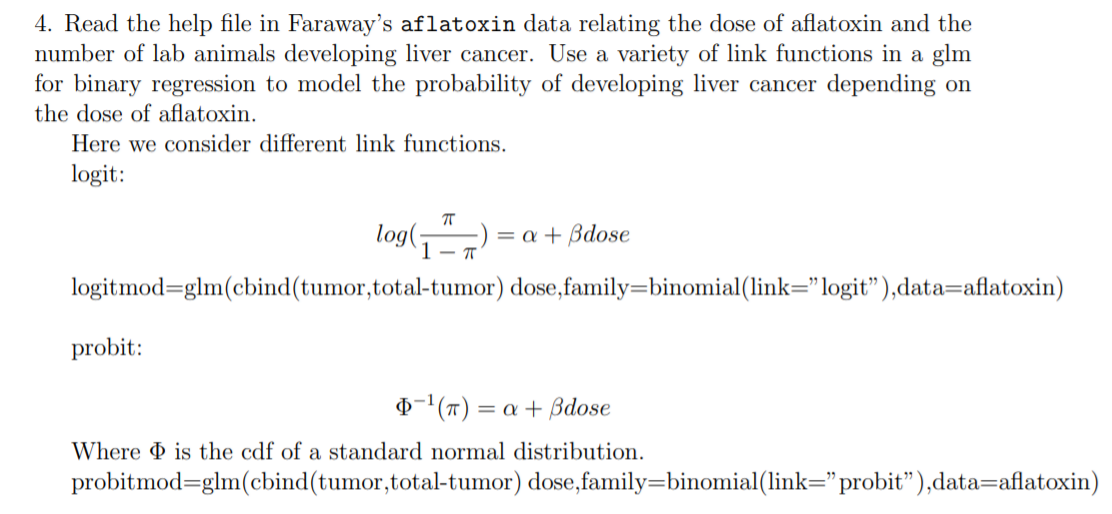
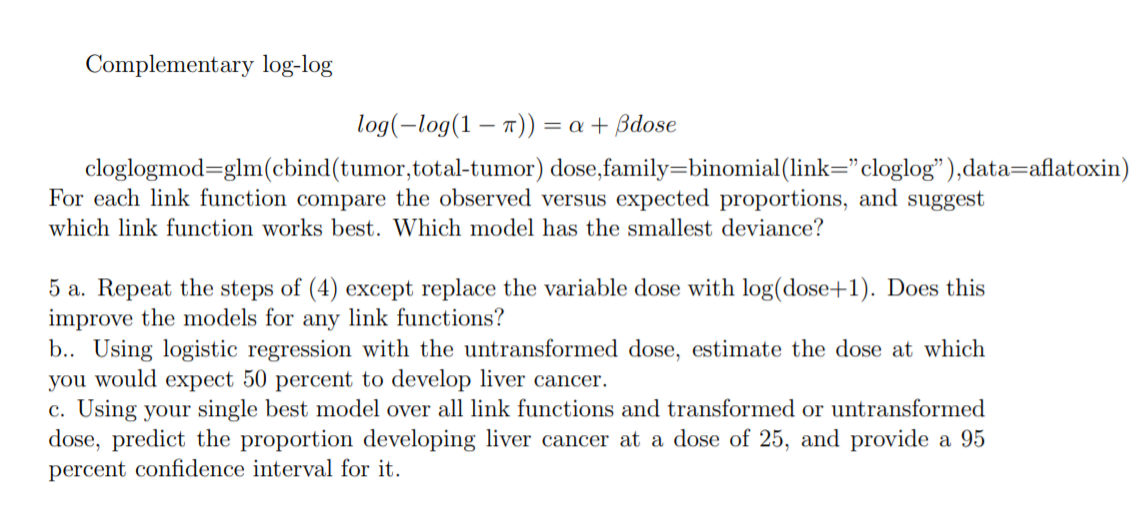
4. Read the help file in Faraway's aflatoxin data relating the dose of aflatoxin and the number of lab animals developing liver cancer. Use a variety of link functions in a glm for binary regression to model the probability of developing liver cancer depending on the dose of aflatoxin. Here we consider different link functions. logit: TT log( 1 - TT = a + Bdose logitmod=glm(cbind(tumor, total-tumor) dose,family=binomial(link="logit"),data=aflatoxin) probit: $ 1(7) = a + Bdose Where & is the cdf of a standard normal distribution. probitmod=glm(cbind(tumor, total-tumor) dose,family=binomial(link="probit" ),data=aflatoxin)Complementary log-log log(log(1 1r)) = a + dose cloglogmod=glm(cbind(tumor,total-tumor) dose,family=binomial(link=\" cloglog\" ),data=aatoxin) For each link function compare the observed versus expected proportions, and suggest which link function works best. Which model has the smallest deviance? 5 a. Repeat the steps of (4) except replace the variable close with log(dose+1). Does this improve the models for any link functions? b.. Using logistic regression with the untransformed dose, estimate the dose at which you would expect 50 percent to develop liver cancer. c. Using your single best model over all link functions and transformed or untransformed dose, predict the proportion developing liver cancer at a dose of 25, and provide a 95 percent condence interval for it
Step by Step Solution
There are 3 Steps involved in it

Get step-by-step solutions from verified subject matter experts