

Question: Please add the matlab graphs as well in the answer! Thank you! Build a code to model the inhibitory cell in the following paper: Kopell,
Please add the matlab graphs as well in the answer! Thank you!
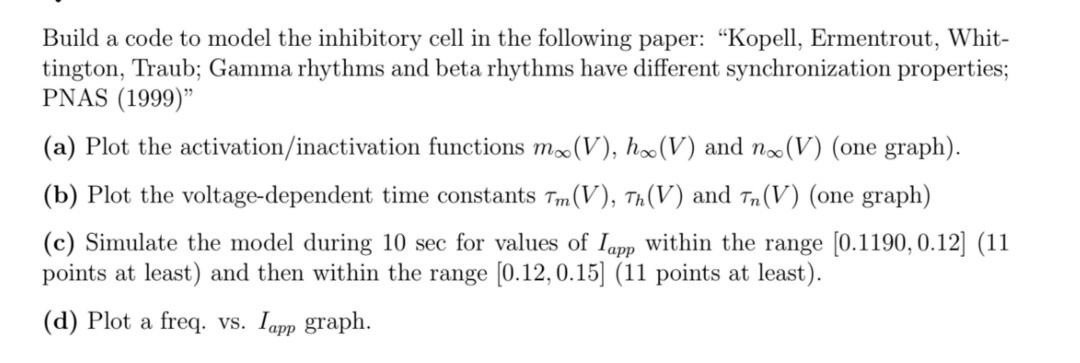
Build a code to model the inhibitory cell in the following paper: "Kopell, Ermentrout, Whittington, Traub; Gamma rhythms and beta rhythms have different synchronization properties; PNAS (1999)" (a) Plot the activation/inactivation functions m(V),h(V) and n(V) (one graph). (b) Plot the voltage-dependent time constants m(V),h(V) and n(V) (one graph) (c) Simulate the model during 10sec for values of Iapp within the range [0.1190,0.12] (11 points at least) and then within the range [0.12,0.15] (11 points at least). (d) Plot a freq. vs. Iapp graph
Step by Step Solution
There are 3 Steps involved in it
1 Expert Approved Answer
Step: 1 Unlock

Question Has Been Solved by an Expert!
Get step-by-step solutions from verified subject matter experts
Step: 2 Unlock
Step: 3 Unlock