

Question: please also help me graph the new SML The following graph plots the current security marketine (SML) and indicates the return that investors require from
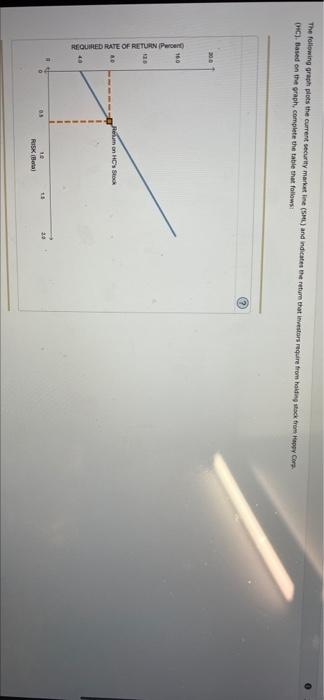
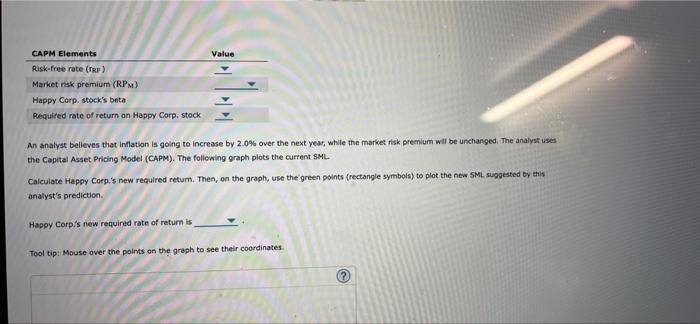
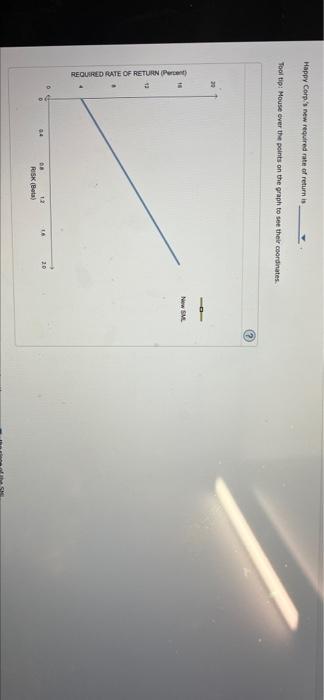
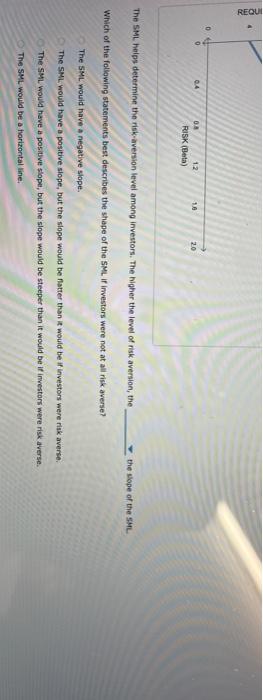
The following graph plots the current security marketine (SML) and indicates the return that investors require from holding compare CHC). Based on the graph, complete the table that follows: 160 115 REQUIRED RATE OF RETURN Prent BD Renon HC's Stock RISKI Value CAPM Elements Risk-free rate (TR) Market risk premium (RPM) Happy Corp. stock's beta Required rate of return on Happy Corp, stock An analyst believes that inflation is going to increase by 2.0% over the next year, while the market risk premium will be unchanged. The analyst uses the Capital Asset Pricing Model (CAPM). The following graph plots the current SML. Calculate Happy Corp's new required return. Then, on the graph, use the green points (rectangle symbols) to plat the new SMI suggested by this analyst's prediction Happy Corp.'s new required rate of return is Tooltip: Mouse over the points on the graph to see their coordinates Happy Corp's new required rate of return is Tooltip: Mouse over the points on the graph to see their coordinates 15 New SM REQUIRED RATE OF RETURN (Percent) . 20 12 RISK Bata REQUI 0 0 04 10 03 12 RISK (Beta) 20 The SML helps determine the risk-aversion level among investors. The higher the level of risk aversion, the the slope of the SML Which of the following statements best describes the shape of the SML ir Investors were not at all risk averse? The SML would have a negative slope. The SML would have a positive slope, but the slope would be latter than it would be if investors were risk averse The SML would have a positive stope, but the slope would be steeper than it would be if Investors were risk overse. The SML would be a horizontal line
Step by Step Solution
There are 3 Steps involved in it

Get step-by-step solutions from verified subject matter experts