

Question: please analyze data and answer the questions A. Data Table: United States begin{tabular}{|l|l|l|l|l|l|} hline multicolumn{2}{|c|}{ Period } & Labor Force & Employment & Unemployment &
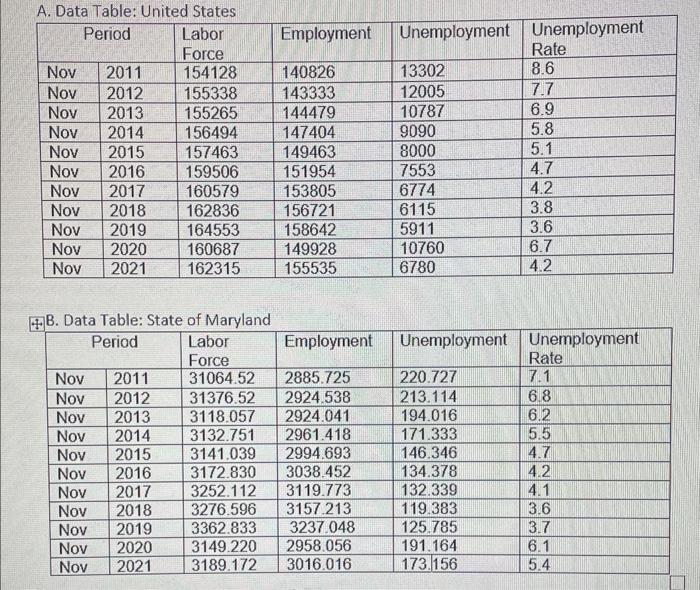
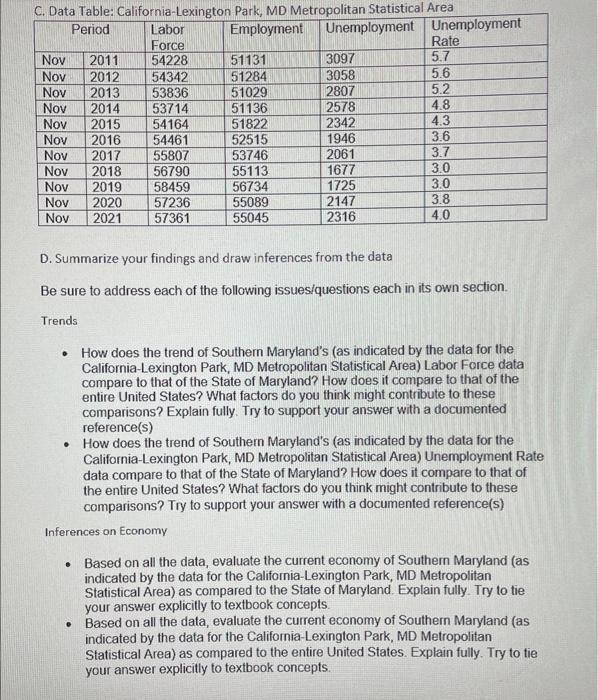
A. Data Table: United States \begin{tabular}{|l|l|l|l|l|l|} \hline \multicolumn{2}{|c|}{ Period } & Labor Force & Employment & Unemployment & Unemployment Rate \\ \hline Nov & 2011 & 154128 & 140826 & 13302 & 8.6 \\ \hline Nov & 2012 & 155338 & 143333 & 12005 & 7.7 \\ \hline Nov & 2013 & 155265 & 144479 & 10787 & 6.9 \\ \hline Nov & 2014 & 156494 & 147404 & 9090 & 5.8 \\ \hline Nov & 2015 & 157463 & 149463 & 8000 & 5.1 \\ \hline Nov & 2016 & 159506 & 151954 & 7553 & 4.7 \\ \hline Nov & 2017 & 160579 & 153805 & 6774 & 4.2 \\ \hline Nov & 2018 & 162836 & 156721 & 6115 & 3.8 \\ \hline Nov & 2019 & 164553 & 158642 & 5911 & 3.6 \\ \hline Nov & 2020 & 160687 & 149928 & 10760 & 6.7 \\ \hline Nov & 2021 & 162315 & 155535 & 6780 & 4.2 \\ \hline \end{tabular} B. Data Table: State of Maryland \begin{tabular}{|l|l|l|l|l|l|} \hline \multicolumn{2}{|c|}{ Period } & Labor Force & Employment & Unemployment & Unemployment Rate \\ \hline Nov & 2011 & 31064.52 & 2885.725 & 220.727 & 7.1 \\ \hline Nov & 2012 & 31376.52 & 2924.538 & 213.114 & 6.8 \\ \hline Nov & 2013 & 3118.057 & 2924.041 & 194.016 & 6.2 \\ \hline Nov & 2014 & 3132.751 & 2961.418 & 171.333 & 5.5 \\ \hline Nov & 2015 & 3141.039 & 2994.693 & 146.346 & 4.7 \\ \hline Nov & 2016 & 3172.830 & 3038.452 & 134.378 & 4.2 \\ \hline Nov & 2017 & 3252.112 & 3119.773 & 132.339 & 4.1 \\ \hline Nov & 2018 & 3276.596 & 3157.213 & 119.383 & 3.6 \\ \hline Nov & 2019 & 3362.833 & 3237.048 & 125.785 & 3.7 \\ \hline Nov & 2020 & 3149.220 & 2958.056 & 191.164 & 6.1 \\ \hline Nov & 2021 & 3189.172 & 3016.016 & 173.156 & 5.4 \\ \hline \end{tabular} Be sure to address each of the following issuesiquestions each in its own section. Trends - How does the trend of Southern Maryland's (as indicated by the data for the California-Lexington Park, MD Metropolitan Statistical Area) Labor Force data compare to that of the State of Maryland? How does it compare to that of the entire United States? What factors do you think might contribute to these comparisons? Explain fully. Try to support your answer with a documented reference(s) - How does the trend of Southern Maryland's (as indicated by the data for the California-Lexington Park, MD Metropolitan Statistical Area) Unemployment Rate data compare to that of the State of Maryland? How does it compare to that of the entire United States? What factors do you think might contribute to these comparisons? Try to support your answer with a documented reference(s) Inferences on Economy - Based on all the data, evaluate the current economy of Southern Maryland (as indicated by the data for the California-Lexington Park, MD Metropolitan Statistical Area) as compared to the State of Maryland. Explain fully. Try to tie your answer explicitly to textbook concepts. - Based on all the data, evaluate the current economy of Southern Maryland (as indicated by the data for the California-Lexington Park, MD Metropolitan Statistical Area) as compared to the entire United States. Explain fully. Try to tie your answer explicitly to textbook concepts
Step by Step Solution
There are 3 Steps involved in it

Get step-by-step solutions from verified subject matter experts