

Question: please and thank you Given below is the data from 10 samples of 5 items each. In addition, the mean (E), range(R), and proportion (p)
please and thank you
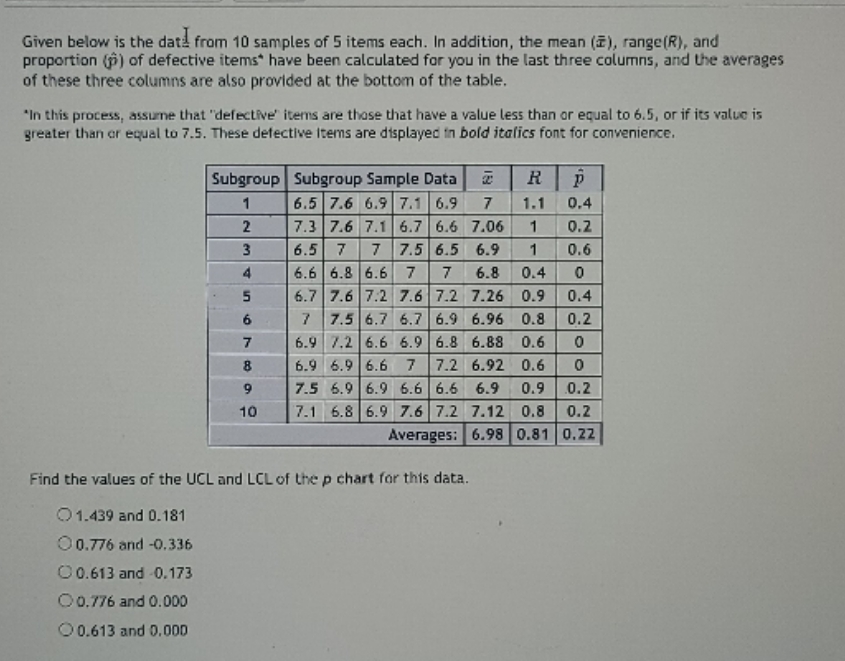
Given below is the data from 10 samples of 5 items each. In addition, the mean (E), range(R), and proportion (p) of defective items* have been calculated for you in the last three columns, and the averages of these three columns are also provided at the bottom of the table. "In this process, assume that "defective" items are those that have a value less than or equal to 6.5, or if its value is greater than or equal to 7.5. These defective items are displayed in bold italics font for convenience. Subgroup Subgroup Sample Data R p 6.5 7.6 6.9 7.1 6.9 7 1.1 0.4 2 7.3 7.6 7.1 6.7 6.6 7.06 1 0.7 3 6.5 7 7 7.5 6.5 6.9 1 0.6 4 6.6 6.8 6.6 7 7 6.8 0.4 5 6.7 7.6 7:2 7.6 7.2 7.26 0.9 0.4 6 7 7.5 6.7 6.7 6.9 6.96 0.8 0.2 7 6.9 7.2 6.6 6.9 6.8 6.88 0.6 6.9 6.9 6.6 7 7.2 6.92 9 7.5 6.9 6.9 6.6 6.6 6.9 0.9 0.2 10 7.1 6.8 6.9 7.6 7.2 7.12 0.8 0.2 Averages: 6.98 0.81 0.22 Find the values of the UCL and LCL of the p chart for this data. 1.439 and 0. 181 0 0.776 and -0.336 0 0.613 and -0.173 O0.776 and 0.0DO 0.613 and 0,000
Step by Step Solution
There are 3 Steps involved in it

Get step-by-step solutions from verified subject matter experts