

Question: please answer 1 & 2 using EXCEL. PLEASE SHOW ALL FORMULAS USED IN CELLS. thank you! nts Beverage Shootout' Coca-Cola vs. Pepsi Financial Statement Analysis
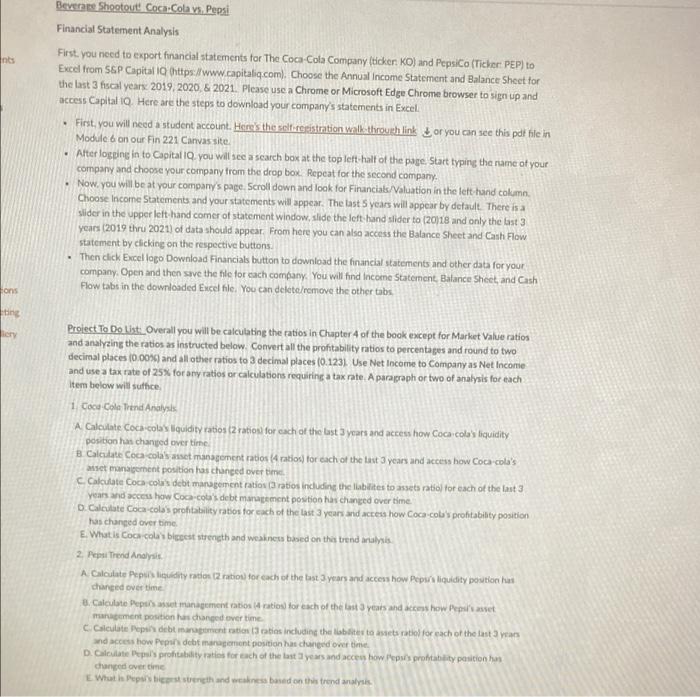
nts Beverage Shootout' Coca-Cola vs. Pepsi Financial Statement Analysis First, you need to export financial statements for The Coca-Cola Company (ticker: KO) and PepsiCo (Ticker PEP) to Excel from S&P Capital (https://www.capitaliq.com. Choose the Annual Income Statement and Balance Sheet for the last 3 fiscal years 2019 2020 & 2021. Please use a Chrome or Microsoft Edge Chrome browser to sign up and access Capital 10. Here are the steps to download your company's statements in Excel . First, you will need a student account. Here's the self-rexistration walk-throwth link or you can see this pdf file in Module on our Fin 221 Canvas site Alter logging in to Capital 10. you will see a search box at the top left half of the pape. Start typing the name of your company and choose your company from the drop box. Repeat for the second company. Now, you will be at your company's page Scroll down and look for Financials/Valuation in the lett-hand cakamo. Choose Income Statements and your statements will appear. The last 5 years will appear by default. There is a slider in the upper left hand comer of statement window, slide the left hand slider to 2018 and only the last 3 years (2019 thru 2021) of data should appear. From here you can also access the Balance Sheet and Cash Flow statement by clicking on the respective buttons Then click Excel logo Download Financials button to download the financial statements and other data for your company. Open and then save the file for each company. You will find Income Statement. Balance Sheet and Cash Flow tabs in the downloaded Excel file. You can delete/remove the other tabs ons ting lery Project To Do Ust. Overall you will be calculating the ratios in Chapter 4 of the book except for Market Value ratios and analyzing the ratios as instructed below. Convert all the profitability ratios to percentages and round to two decimal places (0.00%) and all other ratios to 3 decimal places (0.1231 Use Net Income to Company as Net Income and use a tax rate of 25% for any ratios or calculations requiring a tax rate. A paragraph or two of analysis for each Item below will sutice 1 Coca-Cola Trend Analysis A Calculate Coca-colas liquidity ratios (2 ration for each of the last 3 years and access how Coca-cola's liquidity position is changed over time B Calculate Coca cola's asset management ratios ration) for each of the last 3 years and access how Coca-cola's se management position has changed over time C Calculate Cocacolas debt management ratios ratios including the liabilites to assets ratio) for each of the last 3 years and access how Coca-cola's debt management position has changed over time. D. Calculate Coca-Cola's profitability ratios for each of the last 3 years and actress how Coca cola profitabilty position has changed over time E. What is coa colabicoest strength and weakness based on this trend analysis 2. Pep Trend Analysis A Calculate Pepus luidity ration (2 ratios for each of the best 3 years and access how Pepsi liquidity position changed over time 8. Calevitate Depuis management ratios tratos) for each of the last 3 years and cons how Pensianet rament position has changed over time C.Calculite Pepsi deb margement en caties including the latestonets radiol for each of the last 2 years and access how Pep debt management position has changed over time D. Calculate Pepal's profitability rates for each of the last years and access how depuis profitability posicion hon changed over time Wutha Pupus erigth and weakness based on this trend analysis nts Beverage Shootout' Coca-Cola vs. Pepsi Financial Statement Analysis First, you need to export financial statements for The Coca-Cola Company (ticker: KO) and PepsiCo (Ticker PEP) to Excel from S&P Capital (https://www.capitaliq.com. Choose the Annual Income Statement and Balance Sheet for the last 3 fiscal years 2019 2020 & 2021. Please use a Chrome or Microsoft Edge Chrome browser to sign up and access Capital 10. Here are the steps to download your company's statements in Excel . First, you will need a student account. Here's the self-rexistration walk-throwth link or you can see this pdf file in Module on our Fin 221 Canvas site Alter logging in to Capital 10. you will see a search box at the top left half of the pape. Start typing the name of your company and choose your company from the drop box. Repeat for the second company. Now, you will be at your company's page Scroll down and look for Financials/Valuation in the lett-hand cakamo. Choose Income Statements and your statements will appear. The last 5 years will appear by default. There is a slider in the upper left hand comer of statement window, slide the left hand slider to 2018 and only the last 3 years (2019 thru 2021) of data should appear. From here you can also access the Balance Sheet and Cash Flow statement by clicking on the respective buttons Then click Excel logo Download Financials button to download the financial statements and other data for your company. Open and then save the file for each company. You will find Income Statement. Balance Sheet and Cash Flow tabs in the downloaded Excel file. You can delete/remove the other tabs ons ting lery Project To Do Ust. Overall you will be calculating the ratios in Chapter 4 of the book except for Market Value ratios and analyzing the ratios as instructed below. Convert all the profitability ratios to percentages and round to two decimal places (0.00%) and all other ratios to 3 decimal places (0.1231 Use Net Income to Company as Net Income and use a tax rate of 25% for any ratios or calculations requiring a tax rate. A paragraph or two of analysis for each Item below will sutice 1 Coca-Cola Trend Analysis A Calculate Coca-colas liquidity ratios (2 ration for each of the last 3 years and access how Coca-cola's liquidity position is changed over time B Calculate Coca cola's asset management ratios ration) for each of the last 3 years and access how Coca-cola's se management position has changed over time C Calculate Cocacolas debt management ratios ratios including the liabilites to assets ratio) for each of the last 3 years and access how Coca-cola's debt management position has changed over time. D. Calculate Coca-Cola's profitability ratios for each of the last 3 years and actress how Coca cola profitabilty position has changed over time E. What is coa colabicoest strength and weakness based on this trend analysis 2. Pep Trend Analysis A Calculate Pepus luidity ration (2 ratios for each of the best 3 years and access how Pepsi liquidity position changed over time 8. Calevitate Depuis management ratios tratos) for each of the last 3 years and cons how Pensianet rament position has changed over time C.Calculite Pepsi deb margement en caties including the latestonets radiol for each of the last 2 years and access how Pep debt management position has changed over time D. Calculate Pepal's profitability rates for each of the last years and access how depuis profitability posicion hon changed over time Wutha Pupus erigth and weakness based on this trend analysis
Step by Step Solution
There are 3 Steps involved in it

Get step-by-step solutions from verified subject matter experts